The State of India's Rivers:
Three Decades of Crisis, Policy,
& Community-Led Restoration
A comprehensive longitudinal analysis of riverine health from 1995 to 2025, drawing on CPCB monitoring data, policy evaluations, and Earth5R's citizen-led restoration model.
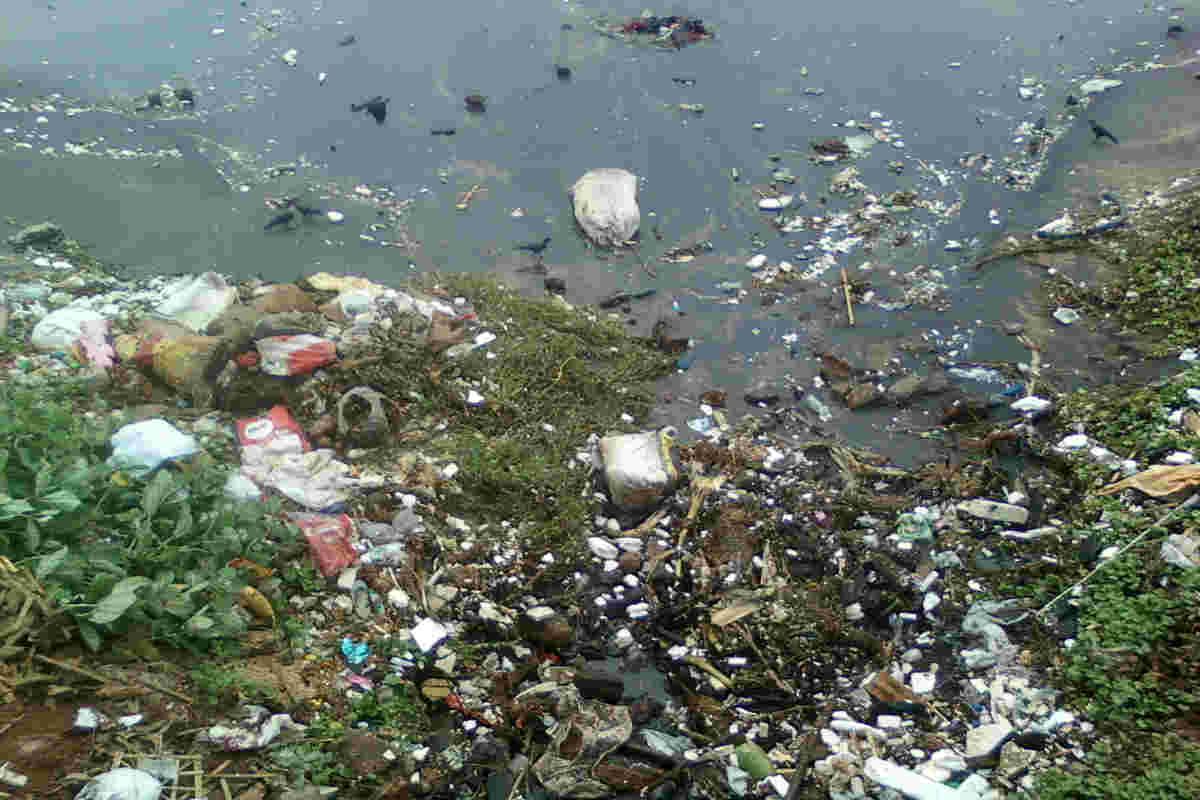
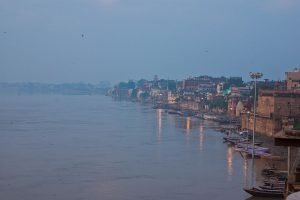
India's rivers—once venerated as sacred lifelines of a civilization—are in the grip of a pollution crisis that has intensified over three decades. From the Ganga and Yamuna to the Sabarmati and Godavari, the nation's 400+ river systems face a convergent threat from urbanization, industrialization, and regulatory inertia. This article presents a comprehensive longitudinal analysis of India's riverine health from 1995 to 2025, drawing on Central Pollution Control Board (CPCB) monitoring data, policy evaluations, international comparative studies, and on-ground case studies. It examines the environmental, economic, agricultural, and public health dimensions of this crisis before exploring Earth5R's citizen-led restoration model as a scalable paradigm for the decades ahead.
1. Introduction: Rivers at a Crossroads
India possesses one of the world's most extensive river networks, shaped over millennia by geological processes and human civilization alike. The Ganga basin alone encompasses 27% of the country's landmass and supports approximately 47% of its population. Across 11 states, these waterways form the economic, cultural, and ecological backbone of a nation of 1.4 billion people. The Brahmaputra carries more sediment than any other river in the world; the Godavari, often called the "Dakshina Ganga," drains seven states of peninsular India; and the Indus tributaries irrigate the breadbasket of Punjab and Haryana. Yet the very rivers that irrigate half of India's agricultural output, supply drinking water to hundreds of millions, and sustain rich aquatic biodiversity have been systematically degraded over the past three decades.
1.1 The Sacred and the Profane
India's relationship with its rivers is unique in the global context. Unlike rivers in many other civilizations that are primarily viewed as economic resources, Indian rivers occupy a deeply spiritual place in national consciousness. The Ganga is venerated as a goddess—Ganga Ma—and millions gather at its banks during the Kumbh Mela, the largest religious gathering on Earth, which attracted an estimated 220 million pilgrims in Prayagraj in 2025. The Yamuna, Narmada, Godavari, Krishna, and Kaveri are each associated with mythological narratives that have shaped art, literature, and cultural practice for millennia. The Rigveda, composed over three thousand years ago, contains hymns dedicated to the Saraswati and Sindhu rivers. This civilizational reverence makes the contemporary degradation of India's rivers not merely an environmental crisis but a cultural and spiritual rupture—a paradox in which a society that worships its rivers simultaneously poisons them.
1.2 Water Stress and Declining Per Capita Availability
The crisis is compounded by rapidly declining per capita water availability. India's annual per capita water availability has plummeted from 5,177 cubic metres in 1951 to approximately 1,486 cubic metres in 2021—a decline of over 71% in seven decades. The Central Water Commission projects that this figure will fall below 1,140 cubic metres by 2050, pushing India firmly into the "water-stressed" category by international standards (below 1,700 m³ per capita). Several major basins—including the Sabarmati, Pennar, and Cauvery—are already classified as "water-scarce," with per capita availability below 1,000 cubic metres. This structural scarcity makes the quality of available water even more critical: when total supply is constrained, the pollution of existing supplies becomes an existential rather than merely environmental concern.
The story of India's rivers over the period 1995–2025 is one of paradox: unprecedented policy attention and budgetary allocation coexisting with persistent—and in many stretches, worsening—pollution. A 1992 WHO study found that out of India's 3,119 towns and cities, just 209 had partial wastewater treatment facilities and only eight had full facilities. By 2025, the Central Pollution Control Board has identified 296 polluted river stretches across 271 rivers in 32 states and Union Territories—a number that, while representing a marginal decline from the 351 stretches recorded in 2018, remains staggering in its scale. This article examines the crisis across ten thematic sections, covering pollution trajectories, the sewage infrastructure deficit, industrial contamination, ecological collapse, policy evolution, public health consequences, economic costs, agricultural degradation, international comparative lessons, the limitations of centralized governance, and finally, the community-led restoration paradigm pioneered by Earth5R.
(CPCB 2025)
Daily in Urban India
Treated
Under Namami Gange
2. Three Decades of Deterioration: A Quantitative Assessment
2.1 The Expansion of Polluted Stretches (1995–2025)
The CPCB has monitored Indian river water quality since the mid-1990s through its National Water Quality Monitoring Programme, which now operates over 4,000 monitoring stations across rivers, lakes, and groundwater bodies. The trajectory of pollution tells a sobering story. By 2005, CPCB monitoring identified 71 polluted river stretches. A decade later, that number had more than quadrupled. By 2018, the assessment recorded 351 polluted stretches across 323 rivers—the highest figure on record. The 2022 assessment reported a modest decline to 311 stretches on 279 rivers; the most recent 2025 report further lowered the count to 296 stretches on 271 rivers.
Polluted River Stretches in India (2005–2025)
The spatial distribution of pollution reveals stark regional patterns. Maharashtra leads with 54 polluted river stretches, driven by the industrial corridors of Pune-Nashik-Mumbai and textile manufacturing hubs along the Bhima and Godavari tributaries. Kerala follows with 31 polluted stretches—a counterintuitive finding for a state with relatively lower industrialization, explained by high population density along riverbanks and virtually no sewage treatment in smaller towns. Madhya Pradesh and Manipur each account for 18 stretches, while Uttar Pradesh, despite containing the most heavily monitored sections of the Ganga and Yamuna, reports a lower count partly because its pollution is concentrated in extremely severe stretches rather than distributed widely.
Top States by Number of Polluted River Stretches (2025)
2.2 Understanding the BOD Classification System
The CPCB classifies polluted river stretches into five priority categories based on Biochemical Oxygen Demand (BOD), the standard indicator of organic pollution load. BOD measures the amount of dissolved oxygen consumed by microorganisms in decomposing organic matter—higher BOD values indicate greater oxygen depletion and more severe ecological stress. Priority I stretches (BOD > 30 mg/L) represent zones of critical ecological failure where dissolved oxygen levels frequently drop to near zero, creating hypoxic "dead zones" incapable of supporting aquatic life. Priority II (BOD 20–30 mg/L), Priority III (BOD 10–20 mg/L), Priority IV (BOD 6–10 mg/L), and Priority V (BOD 3–6 mg/L) represent progressively less severe but still ecologically compromised conditions. The 2025 assessment found 37 Priority I stretches—a reduction from 45 in 2018 but still representing rivers in a state of acute biological collapse. These include the Yamuna through Delhi, where the river receives 80% of its total pollution load in just a 22-kilometre passage through the capital; the Sabarmati through Ahmedabad with BOD readings frequently exceeding 40 mg/L; and the Cooum and Adyar in Chennai, which have effectively become open sewage channels.
2.3 The Sewage Gap: Generation vs. Treatment Capacity
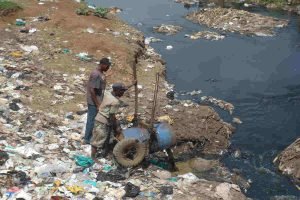
At the heart of India's river crisis lies a persistent and widening gap between sewage generation and treatment capacity. Indian cities generate approximately 72,368 million litres per day (MLD) of sewage—enough to fill 30,000 Olympic-size swimming pools daily. The installed treatment capacity stands at just 31,841 MLD (44% of generation). Critically, actual utilization is far lower: only 26,869 MLD of capacity is operationalized, and actual treated volume is approximately 20,235 MLD—meaning just 28% of India's daily urban sewage receives treatment. The remaining 72%—over 52,000 MLD—flows untreated into rivers, lakes, and groundwater systems.
India's Sewage Generation vs. Treatment Capacity (MLD)
The trajectory shows a system struggling to keep pace. Sewage generation increased from 57,660 MLD in 2015–16 to 72,368 MLD in 2020–21, a compound annual growth rate of 4.68%. Treatment capacity rose from 21,589 MLD to 26,665 MLD—a CAGR of 4.31%. The gap is not closing; it is widening. Even more alarming is the regional disparity: five states—Maharashtra, Gujarat, Uttar Pradesh, Delhi, and Karnataka—account for 60% of total installed treatment capacity, while states like Bihar (which contributes significant pollution to the Ganga), Assam, and several northeastern states have negligible or no operational infrastructure. Rural India, home to 65% of the population, remains almost entirely unserved—rural sewage treatment coverage is estimated at less than 1%.
"The problem is not the river. It is the untreated discharge. STPs are the proven solution—they just need to be comprehensively applied."
— Earth5R River Analysis, 20252.4 Industrial Effluents and Emerging Contaminants
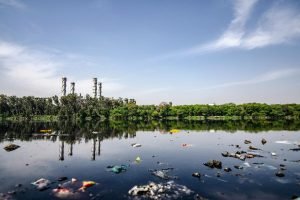
While domestic sewage constitutes the dominant pollution source (accounting for an estimated 80% of total river pollution), industrial effluents present an equally critical—and often more toxic—threat. Industries including textiles, tanneries, sugar mills, paper and pulp, distilleries, and chemical manufacturing discharge heavy metals, persistent organic pollutants, and hazardous substances directly into river systems. The Ganga alone receives over 260 million litres of untreated industrial waste daily from more than 760 grossly polluting industries identified along its course.
The Kanpur stretch of the Ganga illustrates the industrial dimension with particular severity. Over 400 tanneries in the city discharge chromium-laden effluent into the river—chromium being a known carcinogen that persists in riverbed sediments for decades. Despite the installation of a Common Effluent Treatment Plant (CETP), compliance remains erratic, and untreated discharge continues through illegal outfalls, particularly during nighttime hours when monitoring is lax. The Damodar river in Jharkhand—once called the "Sorrow of Bengal" for its flooding, now earning the epithet for its pollution—receives effluent from over 100 coal mines, thermal power plants, and steel works. The Periyar in Kerala carries chemical effluent from industries concentrated around Eloor-Edayar, one of the most toxic industrial hotspots in the country where residents report elevated rates of cancer, respiratory disease, and congenital abnormalities.
Adding a newer dimension to the crisis are emerging contaminants—pharmaceuticals, microplastics, and endocrine-disrupting chemicals—that conventional sewage treatment plants are not designed to remove. Research documented by the India Water Portal highlights pharmaceutical contamination in several river systems, with antibiotics and anti-inflammatory drugs detected at concentrations sufficient to promote antimicrobial resistance. Microplastic studies have detected concerning concentrations across the Ganga basin—averaging 0.028 to 0.053 particles per litre—with higher densities near urban centres and textile manufacturing zones. These contaminants represent a "silent crisis" that current monitoring protocols and treatment technologies are inadequately equipped to address.
2.5 Biodiversity Loss in River Ecosystems
The ecological consequences of river pollution extend far beyond water chemistry. India's river systems support an estimated 2,000 species of fish, crustaceans, molluscs, and aquatic plants—many of them endemic and found nowhere else on Earth. The National Mission for Clean Ganga (NMCG) has documented approximately 2,000 aquatic species in the Ganga basin alone, including 143 fish species, 90 amphibian species, and the critically endangered Gangetic dolphin (Platanista gangetica). Pollution-driven habitat degradation has placed enormous pressure on this biodiversity.
The gharial (Gavialis gangeticus), a fish-eating crocodilian once found throughout the Gangetic and Indus systems, has seen its population collapse from an estimated 5,000 individuals in the 1940s to approximately 182 breeding adults today—a 96% decline driven primarily by habitat loss, fishing net entanglement, and water quality deterioration. However, not all trends are negative. The Gangetic dolphin population has shown a remarkable recovery from approximately 3,000 individuals in 2009 to around 6,327 in the 2021–2023 census, suggesting that targeted conservation efforts under the Namami Gange programme—including the designation of the dolphin as the national aquatic animal in 2009—can yield results when sustained. Similarly, the Indian softshell turtle, hilsa fish, and several species of freshwater prawns have shown localized recovery in stretches where water quality has improved.
2.6 The Groundwater–River Nexus
India's groundwater crisis is inextricably linked to the health of its surface river systems. As the world's largest groundwater user—extracting approximately 250 cubic kilometres annually, more than the United States and China combined—India's aquifer depletion directly reduces base flows that sustain rivers during dry seasons. The Central Ground Water Board estimates that 17% of India's groundwater assessment units are "over-exploited," meaning extraction exceeds recharge. In states like Punjab, Haryana, and Rajasthan, water tables have dropped by 1–3 metres per decade, reducing the perennial flows of rivers like the Ghaggar and Sutlej to seasonal trickles. Conversely, polluted rivers contaminate the aquifers they recharge, creating a feedback loop in which declining water quality above ground degrades water quality below ground and vice versa. Arsenic contamination in the Gangetic alluvial aquifer—affecting an estimated 50 million people across West Bengal, Bihar, and Uttar Pradesh—is partly linked to geochemical changes driven by groundwater over-extraction and altered river-aquifer interactions.
2.7 Sand Mining and River Morphology
An often-overlooked dimension of river degradation is the rampant extraction of sand and gravel from riverbeds. India is the world's second-largest consumer of sand, driven by the construction boom, and much of this demand is met through riverbed mining—legal and illegal. Excessive sand extraction deepens riverbeds, lowers water tables, destabilizes bridges and embankments, and destroys the spawning habitats of fish and freshwater turtles. The Yamuna, Chambal, Son, and numerous rivers in Maharashtra and Karnataka have been severely affected. In some stretches, extraction pits have lowered the riverbed by several metres, disconnecting the river from its floodplain and destroying the riparian wetlands that naturally filter pollutants. The Supreme Court of India has repeatedly intervened to regulate sand mining, but enforcement remains weak, and the economic incentives driving extraction—sand prices have risen fivefold in the past decade in many regions—continue to overwhelm regulatory capacity.
2.8 Climate Change and River Systems
Climate change is introducing a new layer of stress to India's already overburdened river systems. Himalayan glaciers, which feed the Ganga, Indus, and Brahmaputra systems, have lost approximately 40% of their area since the Little Ice Age, with the rate of retreat accelerating since the 2000s. The Indian Institute of Tropical Meteorology projects that under high-emission scenarios, the Gangotri glacier—the primary source of the Ganga—could lose 60% of its volume by 2100, fundamentally altering the river's flow regime from perennial to increasingly seasonal. Simultaneously, climate change is intensifying the Indian monsoon's variability, producing more extreme rainfall events interspersed with longer dry spells. This pattern concentrates pollution loads during low-flow periods (when dilution capacity is minimal) while generating flood pulses that overwhelm sewage treatment infrastructure and flush accumulated pollutants downstream. The 2023 floods in Himachal Pradesh and Uttarakhand, which killed over 400 people, also destroyed multiple STP facilities and released massive quantities of sediment and debris into the Sutlej and Beas systems.
3. Policy Interventions: From GAP to Namami Gange
India's regulatory response to river pollution has evolved across three distinct phases over the past forty years. Each phase has represented an escalation in ambition, budgetary commitment, and institutional complexity—yet the persistent gap between intent and outcome remains the defining feature of India's river governance.
Namami Gange: Project Completion Status (2025)
The Namami Gange Programme's total budgetary allocation from FY 2014–15 to FY 2025–26 stands at ₹26,825 crore, with 502 projects sanctioned. Among these, 212 sewerage projects valued at ₹34,526 crore are at various stages, with 136 STPs now operational at a total capacity of 3,780 MLD. BOD load from grossly polluting industries along the Ganga decreased from 26 TPD in 2017 to 13.73 TPD in 2023—a 47% reduction. The 35 out of 764 grossly polluting industries that remain non-compliant face closure orders. This represents genuine progress, yet the programme's own assessments acknowledge that sustaining water quality improvements requires transitioning from a project-completion mindset to a long-term operational sustainability framework—a transition that has historically been India's Achilles' heel in river governance.
4. Public Health Consequences
The human cost of India's river pollution crisis is enormous and disproportionately falls on the country's poorest communities. According to WHO estimates, 21% of communicable diseases in India are water-related. Approximately 37.7 million Indians are affected by waterborne diseases annually, with 1.5 million children dying from diarrheal illnesses alone—making India the country with the highest number of child deaths from diarrhoea globally. The economic burden is staggering: an estimated 73 million working days lost and financial losses of approximately $600 million per year in direct medical costs and productivity losses.
Health Burden of Water Pollution in India
The disease burden extends across a spectrum of pathogens and chemical contaminants. Cholera, acute diarrheal diseases, typhoid, and viral hepatitis have collectively caused over 10,000 recorded deaths in the past five years, though the actual toll is likely several times higher due to underreporting in rural areas. Groundwater contamination compounds the crisis: arsenic affects 10 states and fluoride 20 states. Chronic arsenic exposure—affecting an estimated 50 million people in the Gangetic alluvial belt of West Bengal, Bihar, Jharkhand, and Uttar Pradesh—causes arsenicosis (skin lesions), peripheral neuropathy, and significantly elevated cancer risk. Fluoride contamination in Rajasthan, Andhra Pradesh, and Tamil Nadu causes dental and skeletal fluorosis, crippling communities with irreversible bone deformities. Heavy metal contamination from industrial effluents—chromium from tanneries, mercury from chlor-alkali plants, lead from battery recycling—introduces a further dimension of chronic toxicity that manifests over years and decades in elevated cancer rates, organ damage, and developmental disorders in children exposed during critical growth periods.
5. The Economic Price of Polluted Rivers
The degradation of India's rivers carries an economic cost that extends far beyond direct healthcare expenditure. A comprehensive World Bank analysis estimated that environmental degradation—of which water pollution is the single largest component—costs India approximately ₹3.75 trillion annually, equivalent to 5.7% of GDP. This figure encompasses healthcare costs, productivity losses from illness and premature death, agricultural yield reductions from contaminated irrigation water, fisheries collapse in polluted stretches, tourism revenue losses, and the capital cost of treating increasingly degraded water for municipal supply.
of Water Degradation
Environmental Damage
(Water Scarcity)
at Risk Annually
India's inland fisheries sector—which contributes approximately ₹7,600 crore annually to the economy and provides livelihoods to over 14 million people—has been severely affected by river pollution. Fish catches in the Ganga declined by an estimated 36% between 2000 and 2020, with several commercially important species including the hilsa, rohu, and catla showing significant population declines in polluted stretches. The Yamuna through Delhi is effectively devoid of fish life for a 500-kilometre stretch downstream of the capital. Tourism revenues along historically significant river cities—Varanasi, Haridwar, Rishikesh, Allahabad—are constrained by water quality conditions that deter both domestic and international visitors from engaging with the river itself, even as spiritual tourism to ghats continues to grow.
Looking forward, the NITI Aayog's Composite Water Management Index warns that water scarcity—driven by the combined effects of pollution, over-extraction, and climate change—could reduce India's GDP by up to 6% by 2050. Cities like Chennai, Bangalore, Hyderabad, and parts of Delhi have already experienced acute water crises in recent years, with Chennai's "Day Zero" in 2019 forcing the city to rely on emergency water tankers and desalination. The economic calculus is clear: the cost of restoring India's rivers, while substantial, is a fraction of the cost of inaction.
Economic Impact of River Pollution Across Sectors
6. Agricultural Impacts: When Rivers Fail the Farm
Approximately 60% of India's net irrigated area depends on surface water from rivers and canals, making agriculture the sector most directly exposed to declining river quality. The use of polluted river water for irrigation introduces heavy metals, pathogens, and chemical residues into the soil-crop-food chain, with consequences that accumulate over years and decades. Studies across the Indo-Gangetic Plain have documented elevated concentrations of cadmium, lead, chromium, and nickel in rice, wheat, and vegetables irrigated with untreated or partially treated river water—concentrations that, in some cases, exceed the food safety standards set by FSSAI and the Codex Alimentarius.
In the peri-urban agricultural zones around Delhi, Kanpur, Agra, and Varanasi—where farmers rely on Yamuna and Ganga water mixed with sewage—studies have found heavy metal concentrations in leafy vegetables (spinach, methi, coriander) at two to five times permissible limits. Soil salinization driven by the use of high-TDS (Total Dissolved Solids) water has rendered an estimated 6.73 million hectares of agricultural land in India partially or fully degraded, with the problem most acute in Rajasthan, Gujarat, Punjab, and Haryana. Farmers using contaminated water report higher incidence of skin diseases, and communities consuming produce from these fields face chronic low-level exposure to toxic metals that conventional washing cannot fully remove.
The Invisible Threat: Heavy Metals in the Food Chain
Research in the Indo-Gangetic Plain has documented cadmium levels in rice at 2–4x FSSAI permissible limits when irrigated with untreated river water. Unlike biological pathogens that can be killed by cooking, heavy metals bioaccumulate in human tissue over years, causing kidney damage, neurological effects, and elevated cancer risk.
The irony is profound: India's Green Revolution, which transformed the country from a food-deficit to a food-surplus nation, was built on irrigation infrastructure that drew from rivers. As those rivers have degraded, the quality of the water feeding into that infrastructure has deteriorated, creating a slow-moving agricultural crisis that threatens not just crop yields but food safety. Climate change compounds this: rising temperatures increase crop water demand at precisely the moment when river flows are becoming less reliable and more polluted during dry seasons.
7. International Lessons: Rivers That Came Back
India is not the first nation to confront a severe river pollution crisis, and the experiences of countries that have successfully restored degraded rivers offer both encouragement and practical lessons. Four international case studies are particularly instructive:
7.1 The Thames, United Kingdom
The Thames was declared "biologically dead" in 1957—devoid of oxygen and fish life through central London. The restoration, driven by the Thames Tideway scheme and sustained investment in sewage infrastructure over five decades, has transformed the river into one of the cleanest urban waterways in Europe. Today, over 125 species of fish inhabit the Thames, including salmon, which returned in the 1970s for the first time since the Industrial Revolution. The key lesson: restoration is possible even for rivers that appear irreversibly degraded, but it requires sustained political commitment across multiple government cycles and a willingness to invest in infrastructure that generates returns over decades rather than electoral terms.
7.2 The Rhine, Germany/Europe
The Rhine—which flows through six countries—was one of Europe's most polluted rivers by the 1970s, with industrial chemicals including heavy metals and chlorinated compounds contaminating water supplies for millions. The International Commission for the Protection of the Rhine (ICPR), established with a multi-national governance framework, implemented a phased restoration programme that combined strict industrial discharge standards, massive investment in wastewater treatment, and ecological restoration of floodplains and wetlands. Salmon returned to the Rhine in 1990 after a 50-year absence. The lesson for India: transboundary river governance (applicable to inter-state rivers) requires institutional frameworks that transcend jurisdictional boundaries, and industrial pollution control requires enforced compliance rather than voluntary adherence.
7.3 The Cheonggyecheon, South Korea
Perhaps the most dramatic example of urban river restoration, the Cheonggyecheon in Seoul was buried under a highway in the 1960s. In 2003, the city dismantled the highway and restored the stream through a $386 million project that included water recycling, ecological design, and integration of the restored waterway into Seoul's urban fabric. Property values along the corridor increased by 30%, biodiversity returned, and the area is now Seoul's most popular public space. The lesson: river restoration can be an economic catalyst, not merely an environmental expense—an insight central to Earth5R's "Arth Ganga" (economic value of rivers) approach.
7.4 The Cuyahoga, United States
The Cuyahoga River in Ohio famously caught fire in 1969—an event so shocking it catalysed the passage of the Clean Water Act in 1972 and the creation of the U.S. Environmental Protection Agency. The Clean Water Act's "polluter pays" principle and technology-based effluent standards transformed American river management. Today, the Cuyahoga supports a thriving recreational economy. The lesson: landmark regulation, when backed by enforcement capacity and political will, can achieve transformational change within a generation. India's equivalent—the Water (Prevention and Control of Pollution) Act of 1974—has the legislative framework but has been undermined by enforcement gaps and the political economy of industrial compliance.
8. The Limits of Centralized Approaches
Despite investment exceeding ₹42,500 crore on Ganga restoration alone—and additional billions on the NRCP and state-level programmes—India's river pollution crisis persists. The reasons are structural and multi-layered. First, infrastructure capacity has not kept pace with urban growth; even if all proposed treatment plants are built, NITI Aayog estimates approximately 49% of urban sewage will remain untreated. The mismatch is arithmetic: India adds 10–12 million urban residents annually, each generating approximately 80–120 litres of sewage per day, while STP construction and commissioning takes 3–5 years per facility.
Second, the operation and maintenance (O&M) of existing infrastructure remains chronically underfunded. A CPCB survey found that approximately 39% of existing STPs do not meet prescribed discharge standards—not because they were poorly designed, but because they are poorly maintained. Many STPs built under earlier programmes stand idle due to power failures (STPs consume significant electricity), maintenance neglect, missing sewer connections (plants built without the trunk sewers needed to feed them), and a shortage of trained operators. Third, river restoration programmes have historically suffered from fragmented governance, with overlapping jurisdictions between central, state, and local bodies diluting accountability. The Yamuna, for instance, passes through five states and two Union Territories, each with its own pollution control board, municipal corporation, and industrial regulatory regime—creating a jurisdictional patchwork where responsibility is diffused and blame is easily deflected.
Fourth, and perhaps most critically, centralized approaches have struggled to build a culture of community stewardship. As Earth5R's Ganga restoration analysis notes, without continuous citizen involvement, most river restoration initiatives fail to sustain their gains beyond the project period. The absence of local ownership transforms river health from an immediate community concern into a distant bureaucratic abstraction. STPs treat wastewater after it has been generated; they do not reduce the volume or toxicity of what enters the sewer in the first place. Without behavioural change at the household and community level—reducing single-use plastics, segregating waste, supporting local monitoring—the engineering solutions remain perpetually overwhelmed by the scale of the problem they are designed to solve.
"Restoration cannot rely solely on beautification or top-down governance. Lasting change requires a multi-layered, science-backed, and community-anchored strategy."
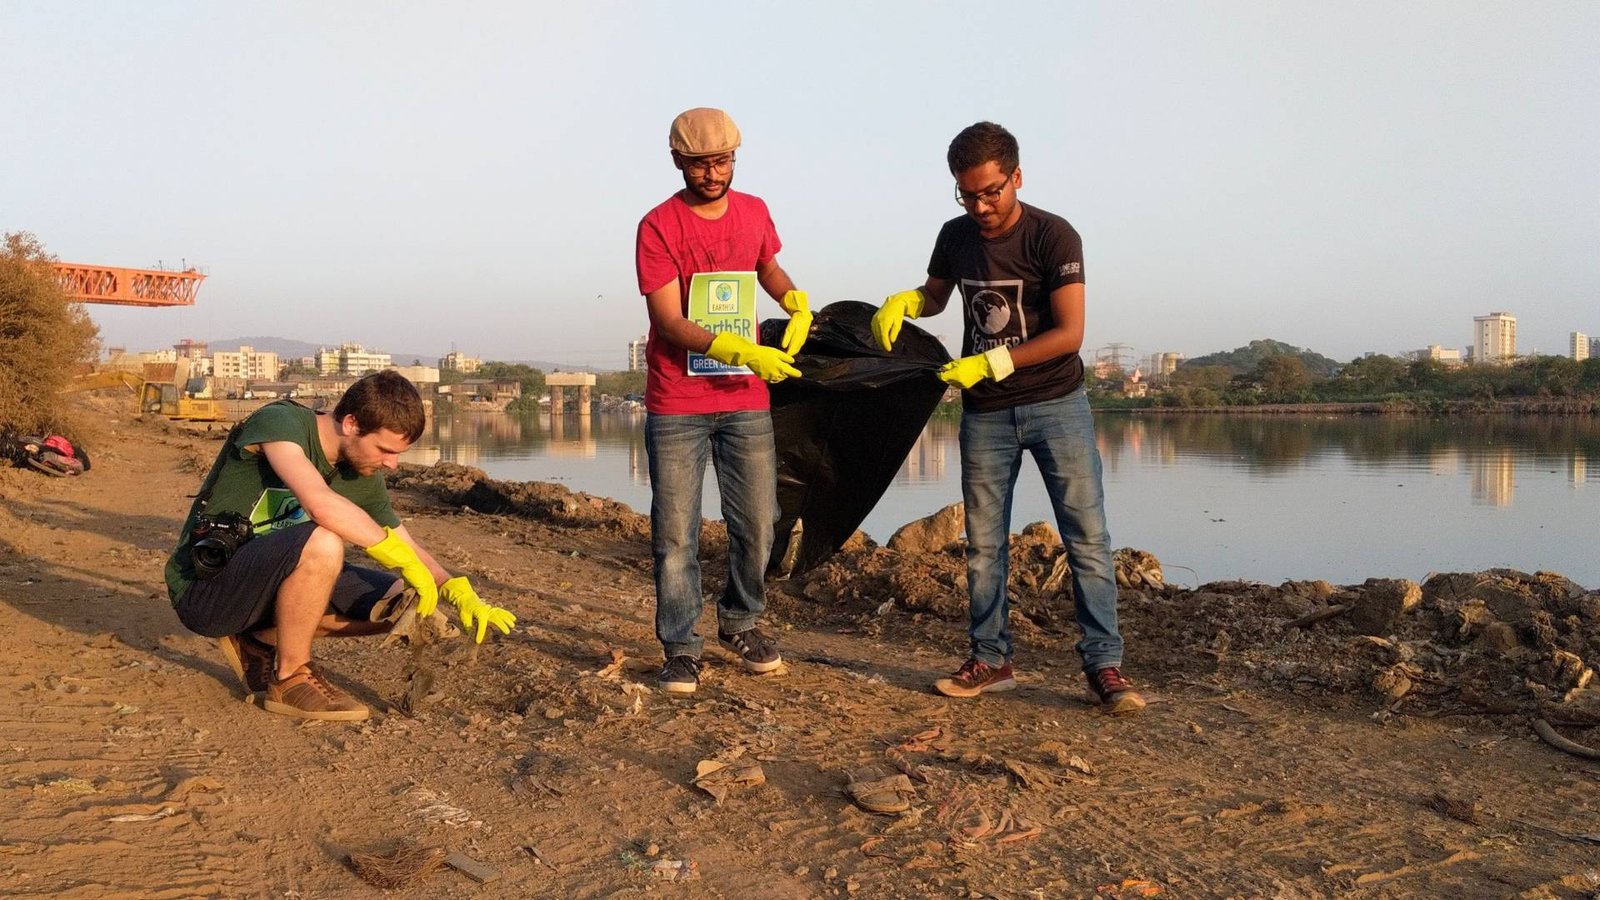
— Earth5R BlueCities Framework, 20259. Earth5R: Pioneering Community-Led River Restoration
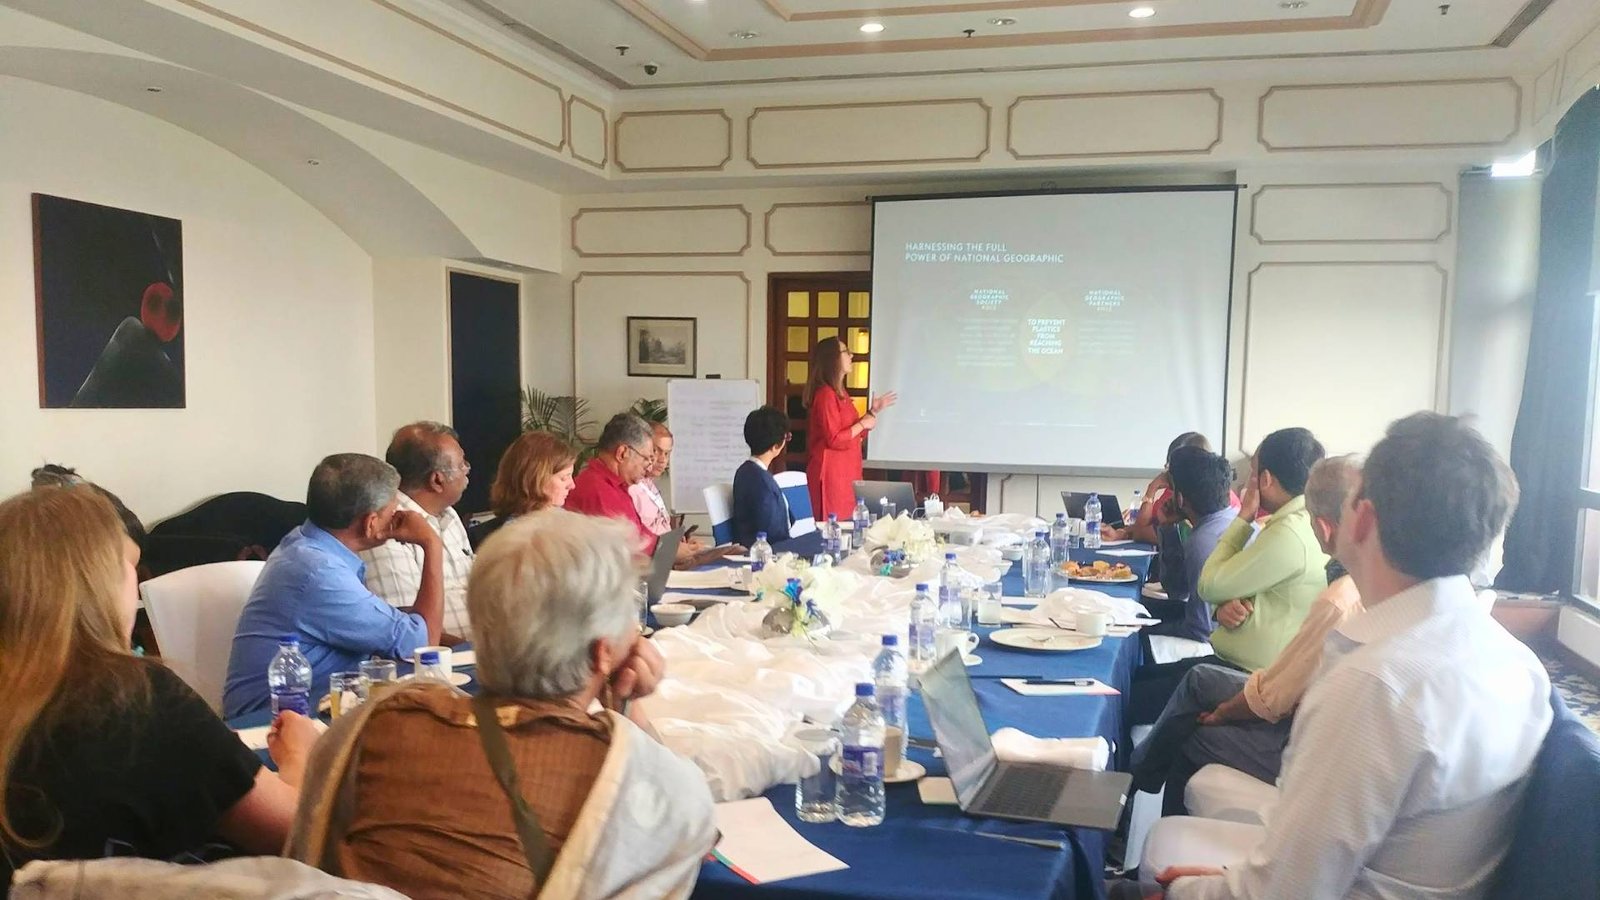
Against the backdrop of institutional limitations, a fundamentally different model of river restoration has been taking shape—one that places communities, technology, and circular economies at the centre of ecological action. Earth5R, an India-based environmental organization operating across 65 countries with 2.5 million community members, has developed a scalable, replicable framework that bridges the gap between government infrastructure and grassroots stewardship. Recognized as a Top 10 Global Sustainability Innovator by Google, Earth5R's model has attracted partnerships with the United Nations, UNESCO, and Mozilla, and has been deployed in collaboration with enterprise partners including NYU Abu Dhabi, Lufthansa, and major Indian institutions.
9.1 The BlueCities Framework
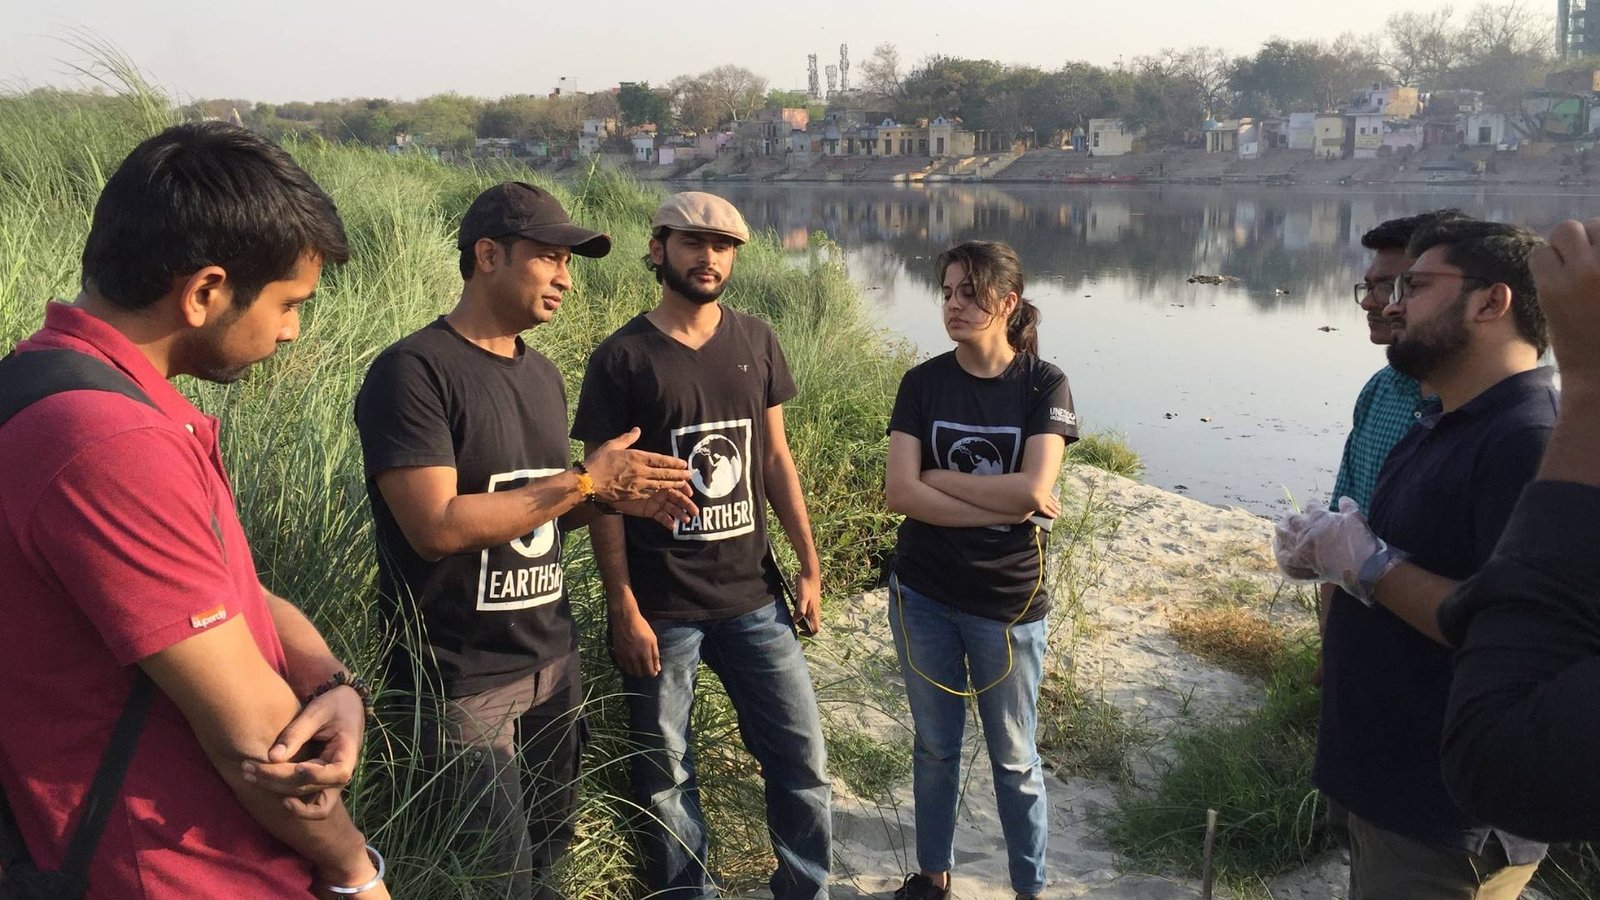
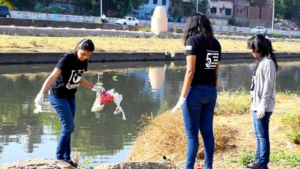
Earth5R's BlueCities initiative operates as a modular, district-level river restoration system built on five interconnected pillars. The framework begins with data-driven river health diagnostics, deploying real-time water testing kits, GIS mapping, and community surveys to establish baseline conditions. This diagnostic phase—measuring pH, BOD, Dissolved Oxygen, nitrates, phosphates, and turbidity—was instrumental in Earth5R's UN-backed river cleanup initiatives in Mumbai. The second pillar—community mobilization—trains local volunteers as "River Guardians" who conduct ongoing monitoring and serve as environmental stewards. The third pillar integrates ecosystem-based restoration techniques including constructed wetlands, riparian buffer planting, and bioremediation. The fourth pillar applies circular economy principles, converting collected river waste into economically valuable products. The fifth pillar—policy integration—ensures that community-generated data feeds into municipal and state-level decision-making, creating a bridge between grassroots evidence and governance action.
📊 Data-Driven Diagnostics
Real-time water quality testing, GIS pollution mapping, and AI-powered dashboards for targeted interventions and transparent monitoring.
👥 Community-First Mobilization
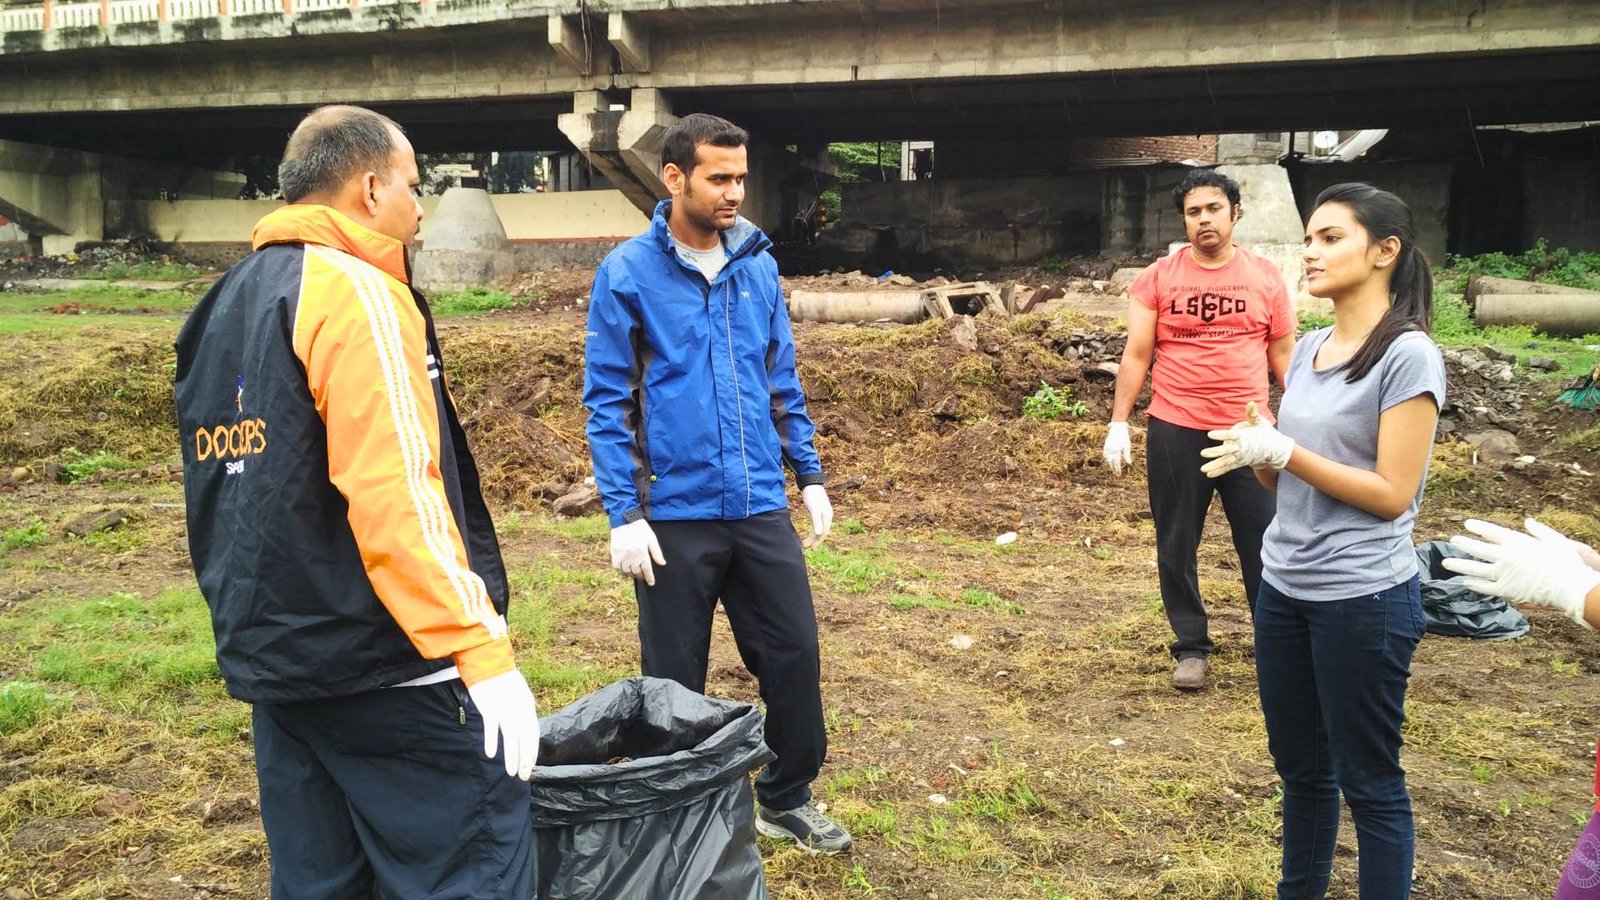
Over 50,000 citizens trained as River Guardians through fellowships, eco-clubs, and sustainability workshops across India.
🌿 Ecosystem-Based Restoration
Wetland creation, riparian buffer planting, bioremediation, and native species reintroduction for ecological resilience.
♻️ Circular Economy Integration
Waste-to-wealth programmes converting river waste via pyrolysis into industrial-grade materials, creating local livelihoods.
9.2 The River Health Index (RHI)
A key innovation in Earth5R's approach is the River Health Index—a community-based monitoring tool that democratizes environmental assessment. Unlike the CPCB's monitoring network, which relies on periodic sampling at fixed stations by professional technicians, the RHI enables continuous, distributed monitoring by trained citizen volunteers. The RHI aggregates data across water quality parameters, biodiversity indicators (macroinvertebrates and fish populations), flow regimes, sediment load, and socio-ecological factors into a composite health score for each river stretch. Trained citizen volunteers—students, community members, and self-help groups—collect this data using standardized protocols, feeding it into centralized dashboards via the Earth5R Sustainability App.
The scientific validity of this participatory approach is supported by research published in Biological Conservation, which has demonstrated that data collected by trained citizen science volunteers can match the reliability of professional assessments when properly structured—validating the scientific credibility of Earth5R's methodology. The RHI thus serves a dual purpose: generating actionable environmental data while simultaneously building the community knowledge and ownership that are prerequisites for sustained restoration.
9.3 On-Ground Impact
Earth5R's model has delivered measurable outcomes across multiple river systems:
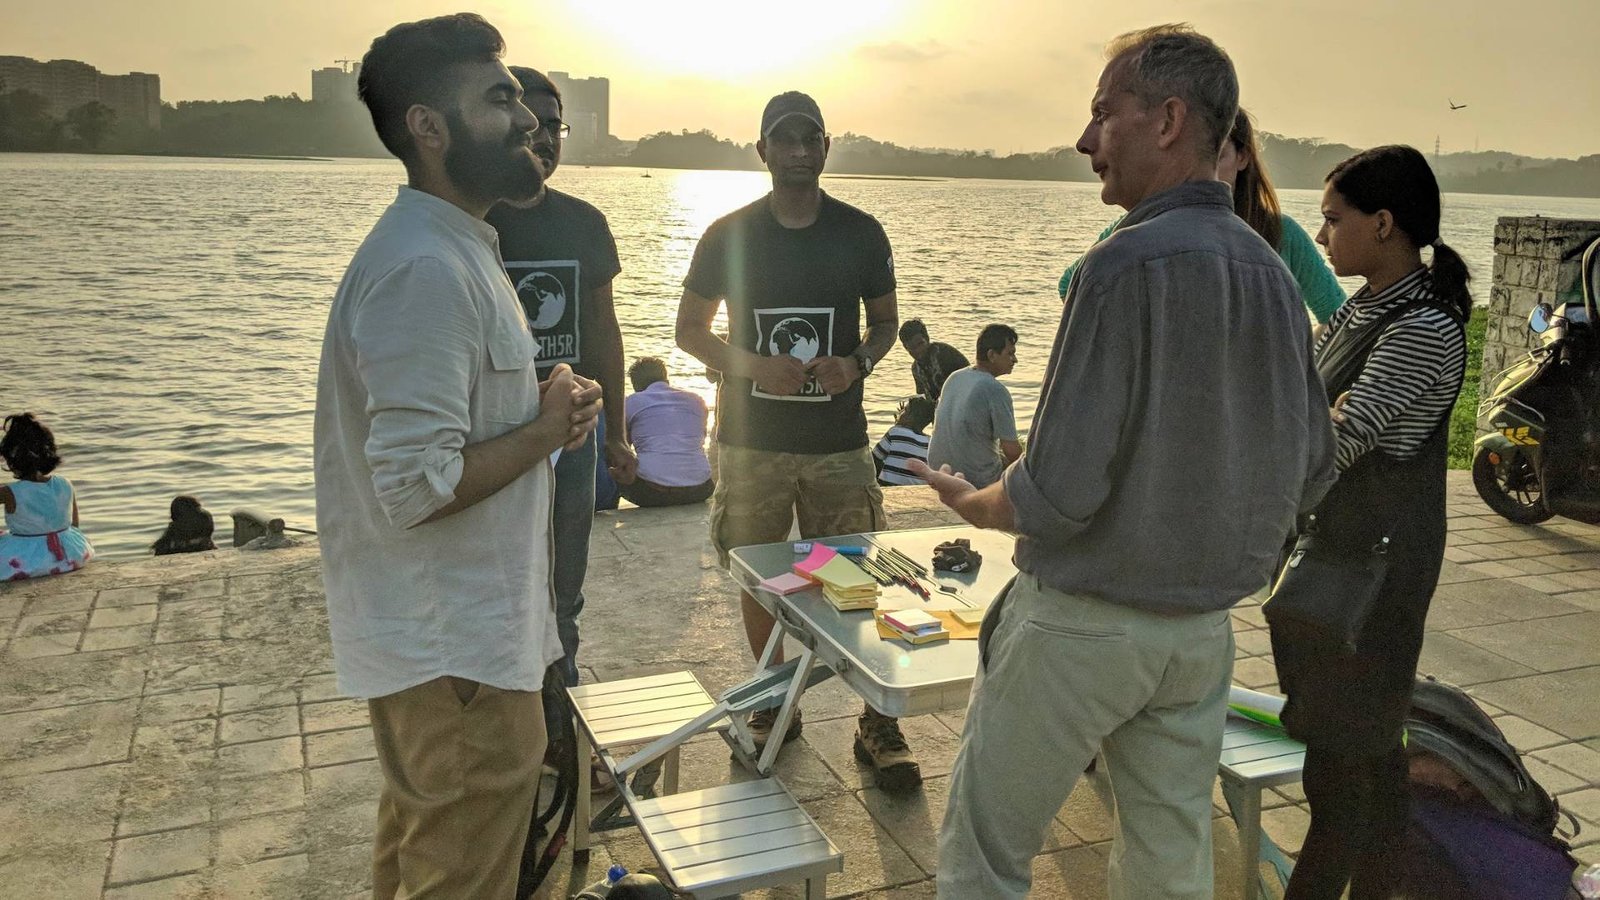
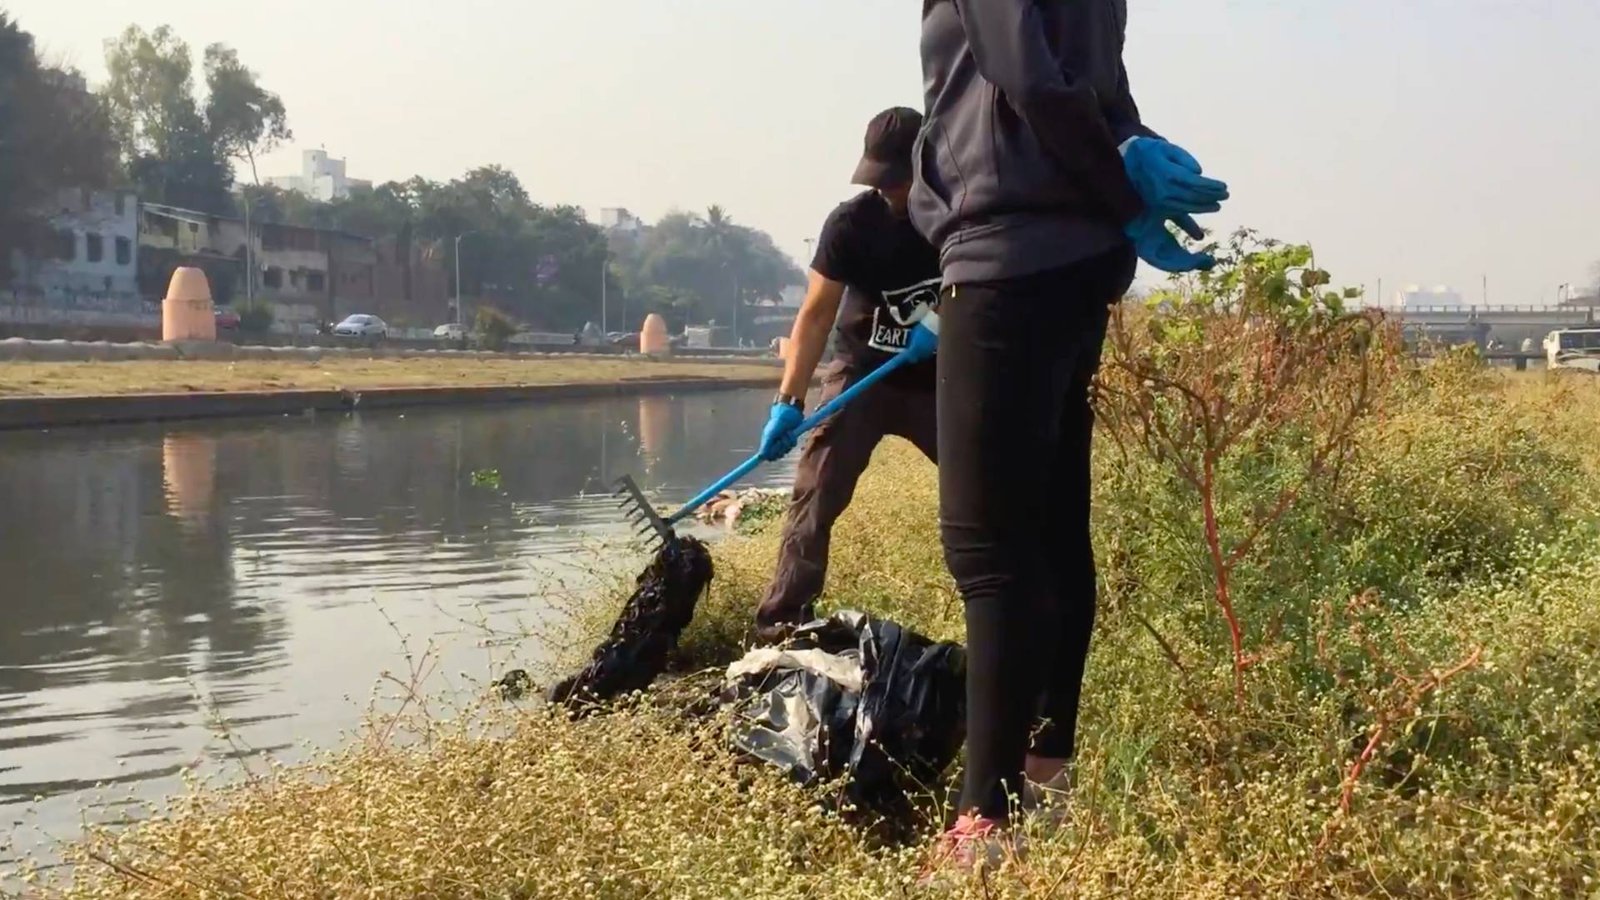
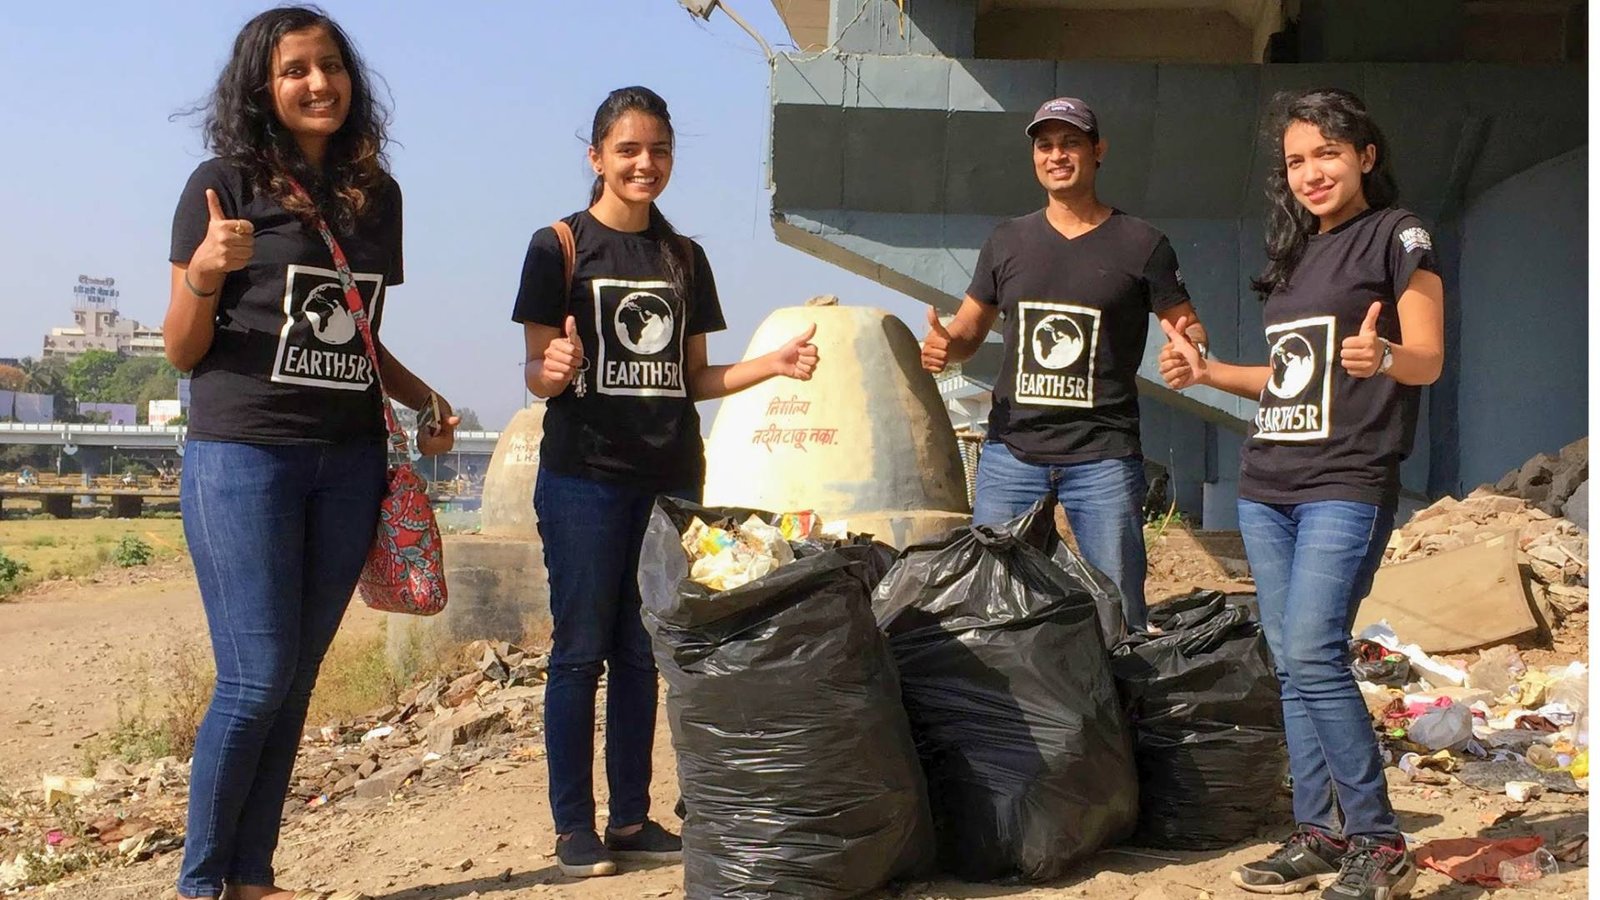
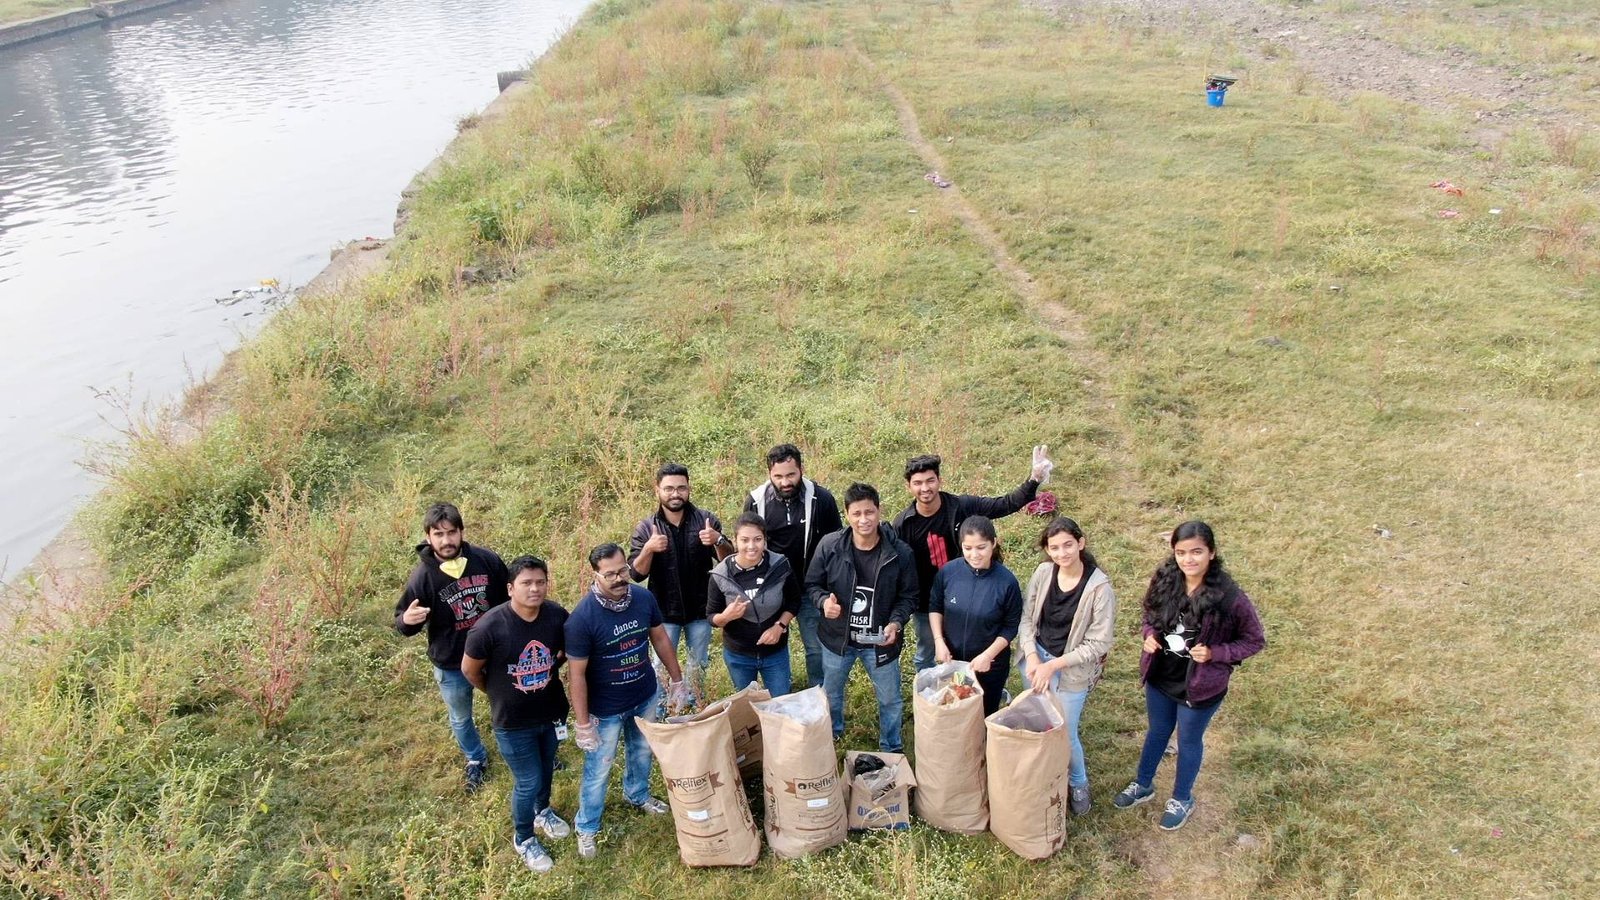
In Pune, the Mula-Mutha Initiative engaged over 2,000 volunteers to remove more than 50 tonnes of waste and plant native species along degraded riverbanks. The programme combined physical cleanup with community education, training local women's self-help groups to monitor water quality on an ongoing basis—creating a self-sustaining monitoring network that continues to operate beyond the initial project period.
In Mumbai, the Mithi River project pioneered a circular economy approach, segregating collected waste and processing non-recyclable plastics through pyrolysis technology to create industrial-grade fuel oil—transforming pollution into economic value and demonstrating that river restoration can generate revenue rather than merely consuming budgets.
The model has been piloted across Maharashtra—spanning Mumbai's Mithi River, Pune's Mula-Mutha, and Nashik's Godavari tributaries—and is expanding into Northern and Eastern India with assessments in Kanpur, Patna, and Ranchi. A six-month restoration project in Rajasthan's Bhilwara district documented measurable improvements in community health indicators alongside water quality gains, establishing a causal link between restoration interventions and public health outcomes that strengthens the case for scaling the model nationally.
9.4 The Dual-Engine Model: Infrastructure + Community
As Earth5R's analysis positions it: national missions provide the essential "hardware"—large-scale sewage treatment plants, interceptor sewers, regulatory enforcement, and industrial compliance monitoring. Citizen-led models provide the critical "software"—a dynamic, community-owned system ensuring long-term sustainability, continuous monitoring, behavioural change at the source, and circular economy approaches that make restoration economically self-sustaining. This dual-engine approach represents what Earth5R terms a "national blueprint for revival," built on three pillars: data-driven decision-making, community ownership, and circular economic models.
The international case studies reviewed in Section 7 reinforce this insight: every successful river restoration programme globally has combined engineering solutions (treatment infrastructure) with governance reform and community engagement. India's unique contribution—pioneered by Earth5R—is the integration of a fourth element: circular economy models that transform the economics of restoration from cost centre to value creator, making community participation financially sustainable rather than dependent on external funding cycles.
10. Conclusion: A 10-Point Action Agenda for India's Rivers
The state of India's rivers over the past thirty years reflects both the scale of the challenge and the inadequacy of approaches that rely solely on centralized infrastructure. While government programmes have achieved notable successes—the doubling of the Gangetic dolphin population, a 47% reduction in industrial BOD loads along the Ganga, and a marginal decline in polluted river stretches—the structural gap between sewage generation and treatment capacity continues to widen, emerging contaminants present threats that existing infrastructure was never designed to address, and the economic and public health costs of river degradation run into trillions of rupees annually.
The evidence assembled in this article—from three decades of CPCB monitoring data, international case studies, economic analyses, and Earth5R's on-ground experience—points toward a clear set of priorities for the decades ahead:
A 10-Point Action Agenda for India's Rivers
1. Close the Sewage Gap — Prioritize decentralized and modular STP technologies that can be deployed faster and scaled incrementally with urban growth, targeting 80% treatment coverage by 2035.
2. Enforce Industrial Compliance — Transition from periodic inspection to continuous real-time effluent monitoring with IoT sensors and automatic penalties for violations, following the "polluter pays" model proven effective in the US and EU.
3. Invest in O&M Sustainability — Mandate dedicated O&M budgets (minimum 15% of capital cost annually) for all STP projects and introduce performance-linked contracts with private operators.
4. Scale Community Monitoring — Adopt the Earth5R River Health Index as a national framework for citizen science-based river monitoring, training 500,000 River Guardians by 2030.
5. Integrate Circular Economy — Build waste-to-wealth processing facilities at every major river cleanup site, converting plastic, organic, and textile waste into economically valuable products.
6. Address Emerging Contaminants — Fund R&D for tertiary treatment technologies targeting pharmaceuticals, microplastics, and endocrine disruptors, and establish monitoring protocols for these contaminants.
7. Protect Groundwater-River Links — Regulate groundwater extraction in river basins where over-exploitation reduces base flows, and establish aquifer recharge zones along degraded river corridors.
8. Climate-Proof River Infrastructure — Design all new sewage and restoration infrastructure for climate resilience, including flood-proofing STPs and incorporating natural flood management through wetland and floodplain restoration.
9. Reform River Governance — Establish basin-level authorities with cross-state jurisdiction (modeled on the ICPR for the Rhine), empowered to set and enforce water quality standards across administrative boundaries.
10. Build the Dual-Engine Model — Institutionalize Earth5R's dual-engine approach through policy mandates requiring community engagement components in all river restoration projects, with dedicated funding for citizen-led monitoring and circular economy integration.
The rivers that shaped Indian civilization now depend on a generation willing to combine scientific rigour, policy reform, technological innovation, and grassroots action. Organizations like Earth5R demonstrate that this combination is not merely aspirational—it is already delivering measurable outcomes at scale. The question is no longer whether India's rivers can be restored, but whether the commitment to do so will match the scale of the crisis. The international evidence is unequivocal: rivers can recover, economies benefit from clean water, and communities transformed by restoration become the strongest advocates for its continuation. India has the policy frameworks, the budgetary resources, the technological capability, and—through organizations like Earth5R—the community mobilization capacity to achieve what the Thames, Rhine, and Cheonggyecheon have demonstrated is possible. What is required now is the sustained will to execute at scale.
📚 Related Reading on Earth5R
How Earth5R is Reimagining River Restoration Through Citizen Participation
How Earth5R is Building India's Largest River Cleanup Ecosystem
8 Rivers That Prove India's Cleanup Movement Is Working
Earth5R's River Health Index: A Community-Based Monitoring Tool
From Polluted to Protected: Community-Led River Guardians
Reviving the Sutlej: A Blueprint for River Restoration
Reviving the Ganga: Earth5R's Blue Cities Model
Rebuilding Rivers, Restoring Cities: India's New Urban Ecology
Cleaning India's Rivers through Behaviour Change & Technology
References & Data Sources
- CPCB, "Polluted River Stretches for Restoration of Water Quality – 2025," September 2025.
- CPCB, "National Inventory of Sewage Treatment Plants," March 2021.
- Press Information Bureau, Government of India, "Details of Namami Gange Programme," July 2025.
- National Mission for Clean Ganga (NMCG), "Namami Gange Programme."
- India Water Portal, "Water Pollution in India: A Comprehensive Overview," November 2025.
- ScienceDirect, "National river conservation plan and water pollutants in India," Economic Analysis and Policy, Vol. 85, 2025.
- Frontiers in Environmental Science, "Wastewater Discharge Standards – The Case of India," 2020.
- IndiaSpend, "Why India Needs to Urgently Rehaul Sewage Treatment Plans," May 2025.
- BharatNama, "Why 70% of Urban Sewage Goes Untreated in India," April 2025.
- Global Recycling, "India's Sewage Treatment Policy," 2017.
- IBEF, "National Mission for Clean Ganga," 2025.
- PIB, "Analysis of water quality of rivers by CPCB," 2022.
- World Bank, "India: Diagnostic Assessment of Select Environmental Challenges," 2013.
- NITI Aayog, "Composite Water Management Index," 2019.
- Central Water Commission, "National Register of Large Dams and Water Availability Assessment," 2021.
- Central Ground Water Board, "Dynamic Ground Water Resources of India," 2022.
- Wohl, E. (2020). "Rivers in the Anthropocene." Annual Review of Earth and Planetary Sciences, 48, 119–145.
- Earth5R, "How Earth5R is Reimagining River Restoration," 2025.
- Earth5R, "River Health Index: A Community-Based Monitoring Tool," 2025.
- Earth5R, "Building India's Largest River Cleanup Ecosystem," 2025.