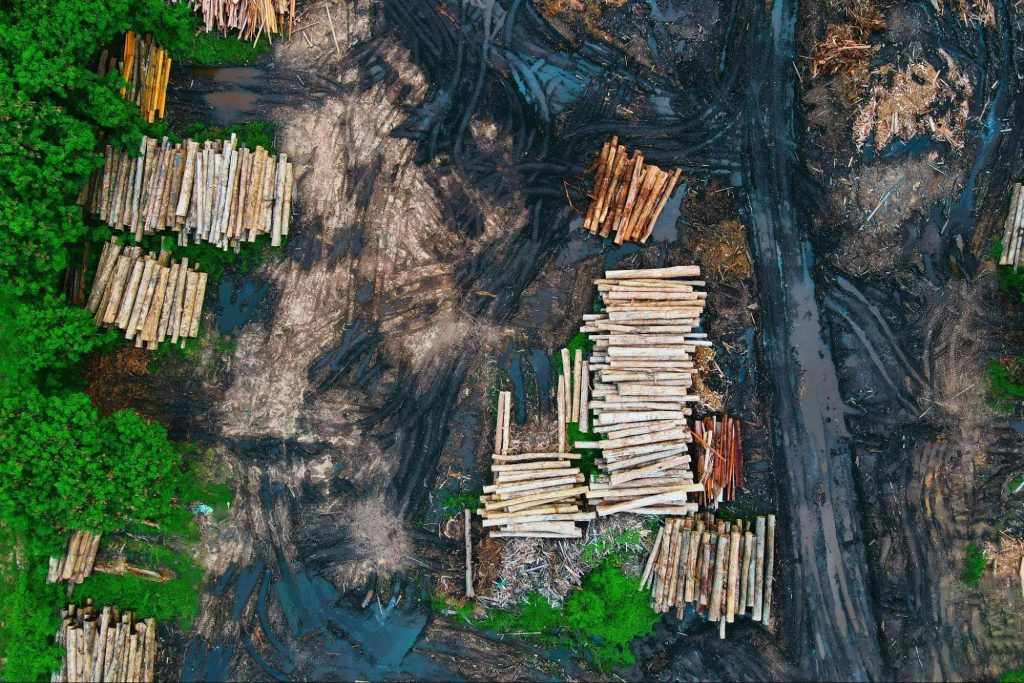
The role of forests in the Earth’s life can not be overestimated. But within the last decades, it has become a matter of life due to agricultural expansion, illegal logging, climate change, and, of course, wildfires. Of course, there are circumstances we can influence and those that we can not. But reforestation challenge must be the primary focus in every environmental program.
With the development of remote sensing technologies, such as satellites and drones, conservationists have access to a set of invaluable tools that enable them to collect precise field data, plan optimal sites, track regrowth, and measure long-term success in the field. What’s more important is that these technologies, like satellite data, are available for local communities that have no billion-dollar budget to implement reforestation projects and for global organizations like IUCN (The International Union for Conservation of Nature), which can rely on Sentinel-2 imagery catalogue to validate reforestation efforts and assess biodiversity impact.
The Role of Sentinel Satellites in Forest Monitoring
Sentinel satellites are operated by the Copernicus program of the European Space Agency. The main goal of the mission is to deliver accessible high-resolution data for agricultural and forestry practices and to help manage food security.
The goal is achieved with the help of the sensors and equipment installed on the satellite. The Copernicus program Sentinel-2 offers multi-spectral data with 13 bands in the visible, near infrared, and short-wave infrared parts of the spectrum. The revisit term is five days, so that forest dynamics can be tracked pretty often. Experts can map canopy density, spot stress in foliage, and detect deforestation at an early stage. Generally, Sentinel-2 data is the primary source for reforestation projects, because it allows:
- To assess the loss or regrowth of forests: With Sentinel-2 satellite imagery, conservationists can identify clear-cutting or fire scars within days rather than months and react quickly.
- To monitor planting projects without expensive surveys: Satellite imagery combined with field plot data allows for estimating biomass changes by up to threefold compared to ground data alone.
- To compare current and historical conditions: Scientists can operate vast archives of Sentinel 2 images and compare them with current satellite imagery for a better understanding of how this or that region developed.
EOSDA LandViewer is a software platform that offers access to Sentinel data to improve reforestation techniques and strategies worldwide, being an ultimate solution widely used by NGOs, researchers, and local communities.
EOSDA LandViewer Expands Focus to Forestry and Agriculture Sectors
Whether it is an NGO, a local farmer, or just an ordinary user who is interested in remote sensing, satellite imagery will be a vital source of information for them. But how do they get it? Platforms, like EOSDA LandViewer, offer easy-to-use tools that connect users to imagery obtained from Sentinel 2, Landsat-8, MODIS, and other commercial sensors. These platforms have an intuitive interface, so that users who are not technical geeks or don’t have specialized knowledge can search, browse, compare, or download imagery from above.
Speaking about agriculture, EOSDA LandViewer integrates Sentinel 2 data, Landsat, and commercial images with vegetation indices:
- Using the NDVI, farmers can get maps of chlorophyll activity. Based on this map, it is possible to spot drought or stress in plants before it is visible. For instance, Iowa corn farmers use weekly NDVI layers to fine-tune irrigation, saving as much as 20% water in dry years.
- SAVI (Soil Adjusted Vegetation Index) is used in arid or semi-arid zones, where bare soil can dominate the signal, and NDVI will not give the complete picture due to the lack of plants.
- ARVI (Atmospherically Resistant Vegetation Index) is used in regions where humidity is high, like Southeast Asia, or in areas with frequent wildfires, because in other way, smoke or pollution might distort NDVI values to track forest canopy health.
LandViewer’s tools are also used in forestry to reveal canopy health and biomass:
- NBR (Normalized Burn Ratio) quantifies burn severity. For instance, it helped California agencies to prioritize replanting after severe wildfires in the region.
- SIPI (Structure-Insensitive Pigment Index) detects subtle pigment changes caused by insects or fungi, allowing early treatment.
- EVI (Enhanced Vegetation Index) tracks biomass in dense Amazon forests, supporting anti-logging patrols.
A Tool for Climate Resilience and Sustainability
Reforestation with a precise satellite imagery plan is the primary strategy to reduce GHG concentration, even in the face of global temperatures climbing. According to the FAO research, restoration of 350 million hectares of degraded land could sequester up to 1.7 gigatonnes of CO₂ annually. Platforms like EOSDA LandViewer can guide conservationists in prioritizing zones for planting and plan the outcome. As a result, reforestation projects become more transparent and verified, enhancing donor confidence and public accountability.
Healthy forests stabilize soils, reducing flood and landslide risks. Tree cover mediates local temperatures and protects natural water supplies. Sustainable forestry can also generate income for rural communities if local authorities and NGOs manage it properly.
Real-World Applications
Reforestation projects have made a huge step forward within the last decade with the help of satellite data. And it touches all the corners of the world:
- Latin America – In Peru and Brazil, scientists combine soil samples with Sentinel 2 imagery to evaluate fertility in degraded Amazonian plots. Time-series analysis shows that native tree cover in some areas has increased by 25–30% within five years according to FAO.
- Africa – Coastal NGOs rely on the Sentinel image archive to track mangrove regrowth after storms. Studies along the Senegal River Delta revealed that planted mangroves stored up to 1,100 tonnes of carbon per hectare, safeguarding fisheries and buffering storm surges.
- Europe – Under the EU Green Deal, afforestation projects use Sentinel data to verify carbon credits and demonstrate compliance with sustainability targets.
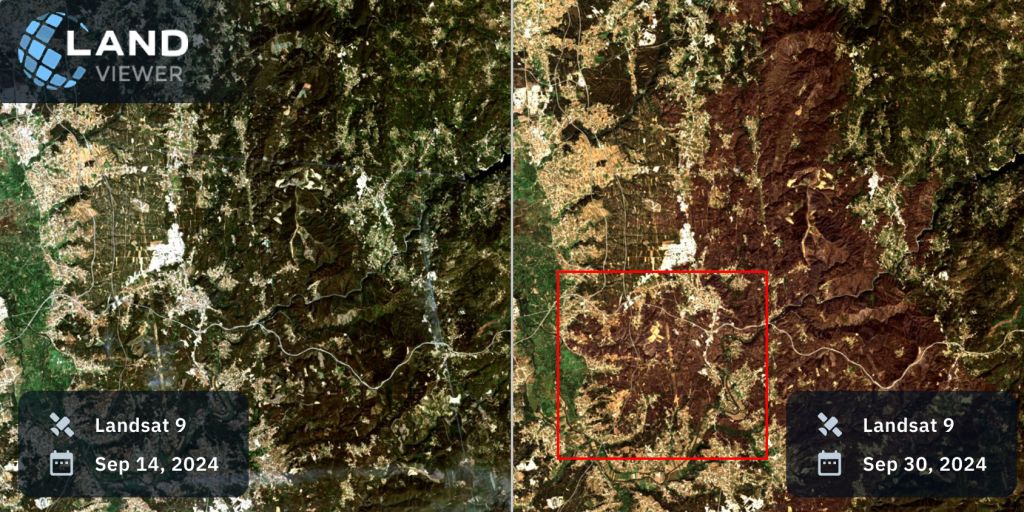
Satellite images from LandViewer (Landsat 9) show the area near Albergaria-a-Velha, Portugal before and after the wildfires in September 2024. The comparison highlights extensive burn scars, where green vegetation turned into dark brown areas after the fires.
With this detailed and transparent information from space, local communities, businesses and the whole states have become more engaged in forest protection initiatives while meeting climate and economic goals.
______________
Author :
Kateryna Sergieieva has a Ph.D. in information technologies and 15 years of experience in remote sensing. She is a scientist responsible for developing technologies for satellite monitoring and surface feature change detection. Kateryna is an author of over 60 scientific publications.