Plastic Waste Management & EPR Intelligence:
A Decade of Forensic Sustainability Evidence
A comprehensive, data-driven case study built on 10 years of field data spanning 28 states and 8 union territories of India, thousands of pin codes, and 8.5 million verified data points — examining plastic waste generation, segregation performance, EPR compliance risk, and community behaviour change from January 2015 to December 2025.
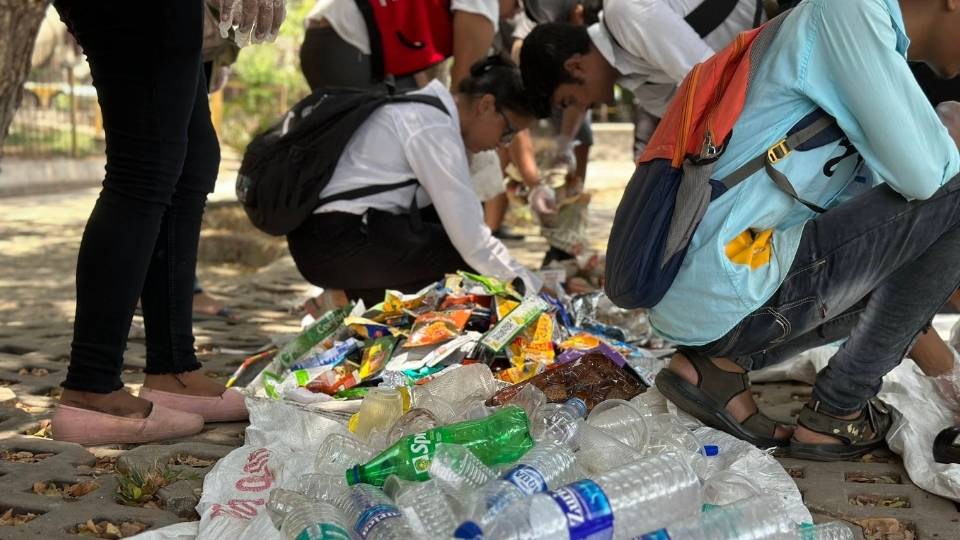
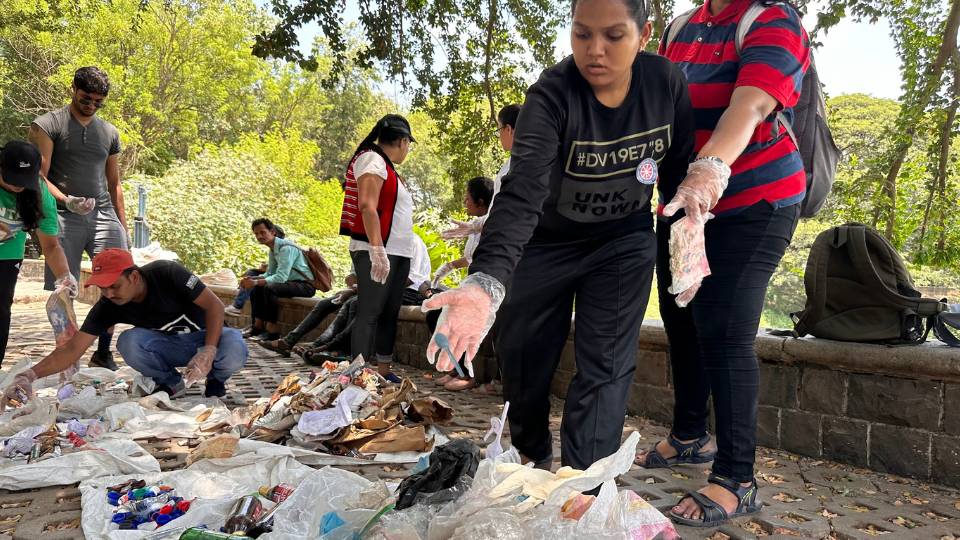
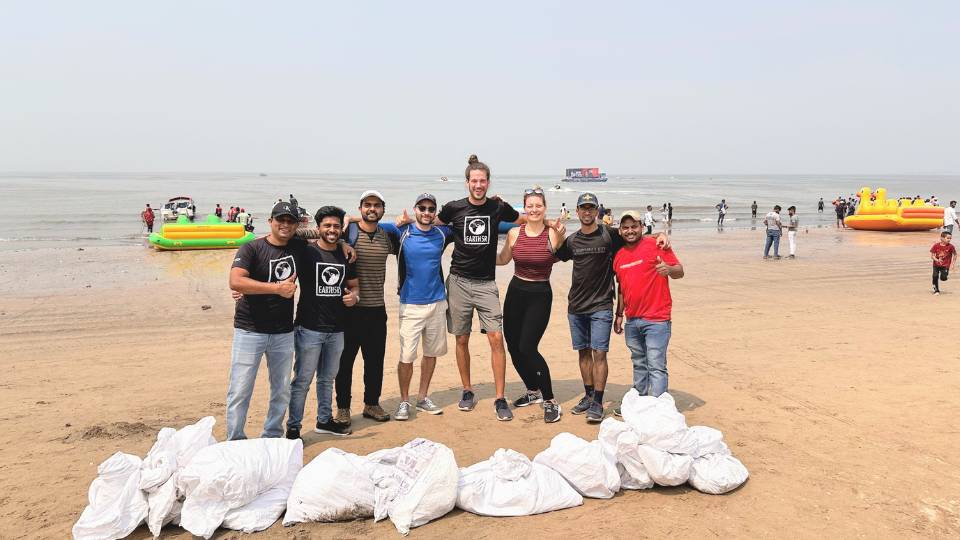
This research was made possible by the extraordinary dedication of 1.3 million citizens, community leaders, and grassroots volunteers who showed up day after day — segregating waste, recording data, and building a cleaner India from the ground up.
This case study presents a longitudinal, multi-dimensional forensic analysis of plastic waste generation, segregation performance, Extended Producer Responsibility (EPR) compliance risk, and behavioural change dynamics across India from 2015 to 2025. Drawing on Earth5R's proprietary Forensic Sustainability Operating System (SaaS-X) and community data networks spanning 28 states and 8 union territories, thousands of pin codes, and 8.5 million verified data points, this research quantifies the structural pressures facing plastic-packaging-dependent industries and evaluates the effectiveness of field-based interventions in achieving measurable ESG outcomes.
Over the study decade, India's total municipal solid waste increased by 54.7%, while plastic's share of that waste rose from 21.5% to 32.6% — driven almost entirely by packaging consumption. Despite systemic headwinds including COVID-19 disruption (2020), informal-sector fragility, and multi-layer packaging proliferation, national segregation rates climbed from 40.4% (2015) to 66.2% (2025), demonstrating that sustained, behaviour-centred programming combined with EPR-aligned corporate partnerships can generate verifiable, scalable environmental impact.
Key findings include: (1) packaging waste constitutes over 81% of all plastic waste in mature urban centres; (2) EPR risk multipliers range from 1.02 (Delhi) to 1.60 (Ladakh), creating highly differentiated liability exposure for plastic-packaging industries; (3) informal sector dependence averaging 62.9% nationally represents the critical but under-governed node in India's plastic circular economy; and (4) behaviour change requires at least 20–38 days of reinforced engagement to achieve habituation, with participation decay rates exceeding 25% in 14 states.
Cite as: Earth5R Research Division. (2026). Plastic Waste Management & EPR Intelligence: A Decade of Forensic Sustainability Evidence (2015–2025). Earth5R ESG Intelligence Platform. Report No. PWM-2025-001.
The Plastic Packaging Crisis: Scale, Scope & Systemic Risk
India's rapid economic growth and e-commerce expansion have driven an unprecedented surge in plastic packaging generation, creating compounding risks for producers, policymakers, and ecosystems alike.
India's Plastic Waste Crisis: Growth Trajectory (2015–2025)
Total municipal waste and plastic waste volumes across 36 states & UTs. Source: Earth5R SaaS-X Forensic Dataset.
Plastic Waste Composition Shift (2015 vs. 2025)
Breakdown of plastic waste by polymer type. Multi-layer packaging (MLP) shows the most alarming growth rate among all streams.
Critical Finding: Plastic's share of total municipal solid waste grew from 21.5% in 2015 to 32.6% in 2025 — a structural shift driven primarily by single-use packaging proliferation, e-commerce growth (Ecommerce Intensity Index: 0.18 → 1.41 in urban centres), and rapid food delivery expansion. This trajectory places escalating EPR compliance obligations on every company operating within plastic-packaging supply chains in India.
The Scale of Human Commitment Behind This Data
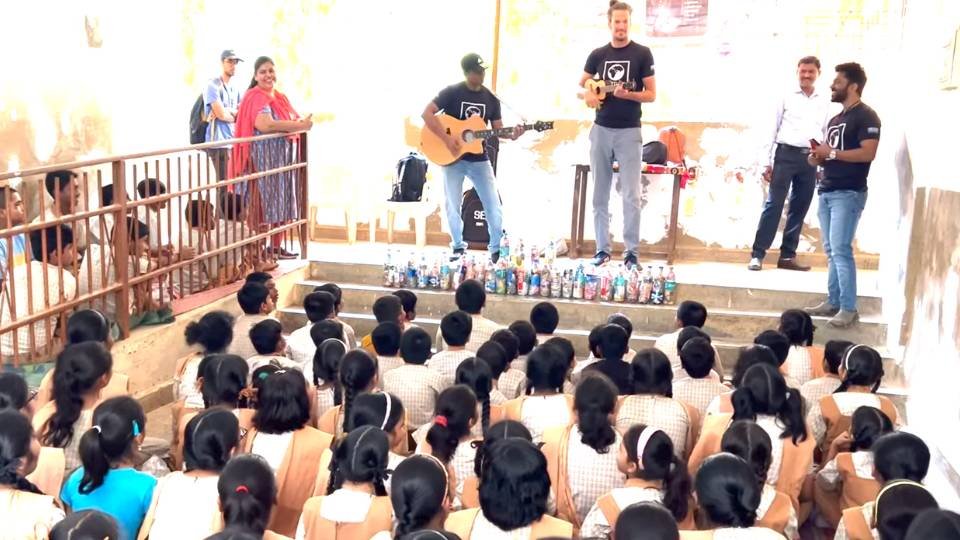
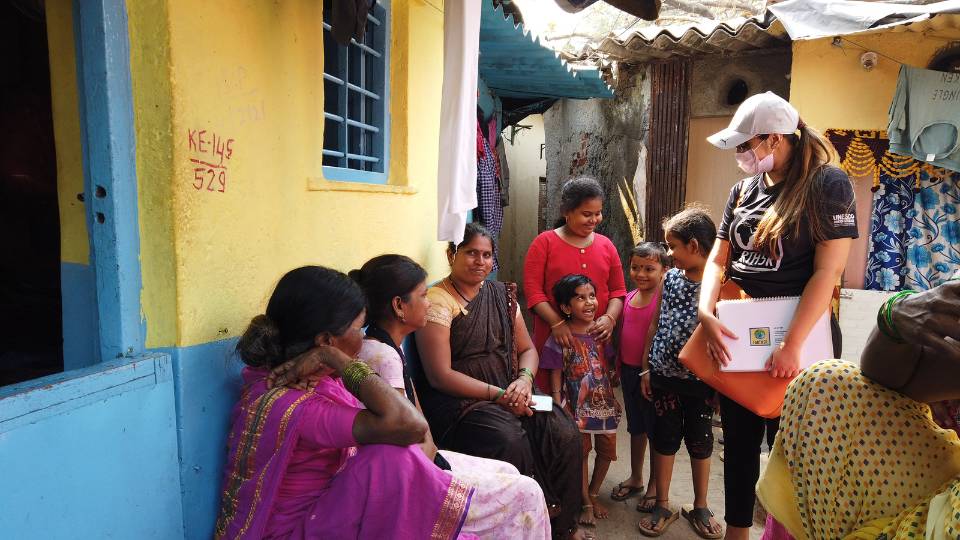
Behind every data point in this report is a real person — a student who learned to sort her family's waste, a waste picker who mapped his daily route, a community leader who knocked on doors in the summer heat. 1.3 million individuals across India chose to participate in building this evidence base. The Earth5R team, and the thousands of community champions they trained, turned individual acts into a national dataset that now informs policy, industry, and investment decisions across 65 countries. This is what citizen science looks like at its most impactful.
Policy & Regulatory Timeline
National Segregation Rate vs. Plastic Share Growth
Two competing forces: plastic's growing dominance vs. improving segregation infrastructure. The 2020 COVID dip is clearly visible.
Forensic Sustainability Methodology
Earth5R's SaaS-X platform integrates citizen-generated field data, waste characterisation protocols, behavioural science frameworks, and EPR risk modelling into a unified forensic audit system.
Layer A: Material Characterisation
Waste fractions identified by polymer purity (0–20 score), recoverability from MRF acceptance trials, form-factor risk assessment, and capture probability testing. Laboratory-validated for polymer composition.
Layer B: Behavioural Science
Household segregation consistency tracking (% correct days), participation decay modelling (12-week drop), habit formation timing, municipal trust indexing, and community champion density measurement.
Layer C: EPR Risk Intelligence
State-level EPR risk multipliers combining downstream collection friction, sorting contamination friction, material market friction, shock vulnerability, and policy readiness scores. Validated against CPCB compliance data.
| Data Dimension | Metric | Source / Validation | Temporal Coverage | Confidence Level |
|---|---|---|---|---|
| Waste Volume | Tonnes by waste fraction (14 streams) | Ward-level field audits, SaaS-X characterisation | Annual, 2015–2025 | High |
| Segregation Rate | % waste properly segregated at source | Household surveys, doorstep collection logs | Annual, 2015–2025 | High |
| Plastic Composition | Polymer-specific weight fractions | MRF gate records, lab sampling | Annual, 2015–2025 | High |
| EPR Risk Multipliers | State-level risk scoring (36 states) | CPCB filings, collection audits, expert panel | Cross-sectional 2025 | Medium–High |
| Behavioural Indices | Segregation consistency, decay, habit formation | Citizen cohort tracking (n>1,200,000) | Annual, 2015–2025 | High |
| Informal Sector | Waste picker preference, rejection rate, income volatility | Direct field interviews, structured surveys | Annual, 2015–2025 | Medium |
| Economic Proxies | E-commerce index, food delivery penetration | Platform APIs, consumer surveys | Annual, 2015–2025 | Medium |
Methodological Note: All tonnage figures are derived from statistically representative waste characterisation studies at ward and municipal body level, scaled using population-adjusted extrapolation. Segregation rates represent verified source-separation (not downstream processing). Behavioural indices are composite scores derived from cohort-tracking across Earth5R's 1.2 million+ citizen network. EPR risk multipliers should be interpreted as relative indicators for strategic planning rather than absolute compliance assessments.
National Waste Trends: 11-Year Longitudinal Analysis
Decade-long data across 36 states reveals a complex picture of rising plastic volumes, improving but fragile segregation systems, and significant inter-state variation in collection capacity.
Segregation Rate Trajectory (2015–2025)
National average segregation rate. COVID-19 caused a 16.7 percentage-point collapse in 2020, followed by strong recovery exceeding pre-pandemic levels.
Multi-Layer Packaging: The Fastest-Growing Risk Stream
MLP volumes nationally — the most difficult-to-recycle plastic stream, with near-zero market value and zero informal sector preference.
Plastic Waste by Type — National Annual Totals (2015–2025)
Stacked area chart of all major plastic fractions across 36 states. Demonstrates the growing dominance of flexible and multi-layer formats over rigid, high-value recyclables.
Top Performing States by Collection Yield
Highest Plastic Leakage Risk States
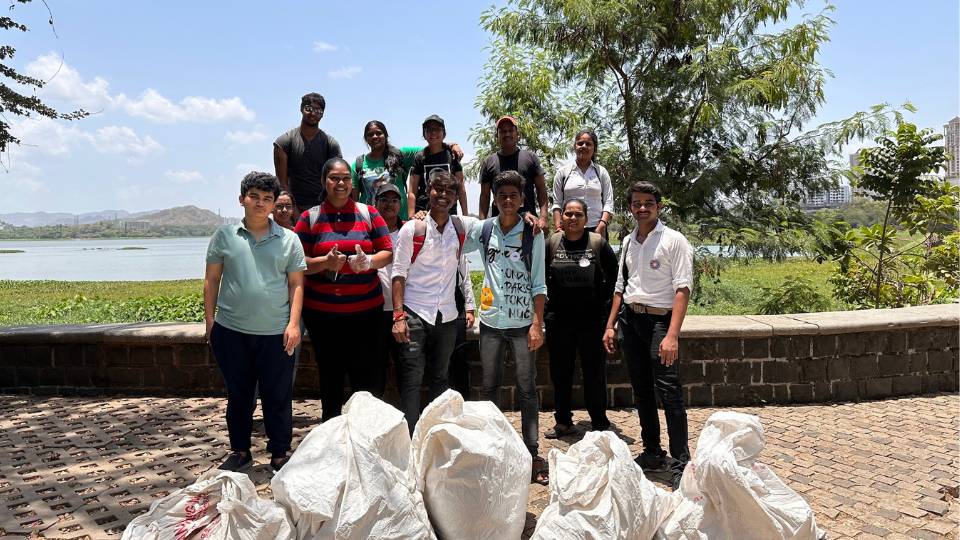

Field operations across 28 states and 8 union territories — the Earth5R team's dedication to ground-level data collection makes the national-scale analysis in this report possible.
Research Finding 3.1 — The Segregation Plateau Risk: While national segregation rates improved by 25.8 percentage points over the study period, the rate of improvement is decelerating. The delta between 2023 and 2025 was only 2.4 percentage points, suggesting India is approaching a structural ceiling at approximately 70–72% without fundamental changes to packaging design, EPR enforcement intensity, or informal sector formalisation. Companies relying on current EPR infrastructure for compliance verification face growing leakage risk in states outside the top quartile.
Urban Epicentres: City-Level Forensic Analysis
Eight major Indian cities represent disproportionate concentrations of plastic packaging consumption. Their performance trajectories reveal the urban dynamics that will determine India's EPR compliance future.
City-Level Segregation Rates (2015–2025): Mumbai & Delhi
Longitudinal segregation performance for India's two largest MSW generators. COVID disruption visible in 2020 for both cities.
Plastic Share of Total Waste — Mumbai vs. Delhi (2015–2025)
Plastic's growing dominance in the waste stream, driven by packaging. COVID-19 caused a sharp spike as single-use plastic demand surged.
Comparative City Performance: Plastic Volume 2025 (Tonnes)
Total plastic waste identified across 8 cities in 2025, with segregation rate overlay. Delhi and Mumbai lead in volume; Delhi leads in collection efficiency.
Mumbai
Saturation RiskMumbai's waste system is experiencing structural saturation despite continued growth. With packaging waste constituting 81.4% of all plastic waste in 2025, the city reflects national-scale challenges in managing flexible and composite packaging at scale. E-commerce intensity reached an index of 1.32 by 2025, making Mumbai one of India's highest-pressure EPR compliance zones.
Delhi
Model StateDelhi demonstrates that governance quality is the primary determinant of EPR success. With India's lowest EPR risk multiplier (1.02), lowest leakage rate (9.1%), and highest segregation rate among major cities (85.3%), Delhi provides the replicability benchmark. Its success correlates with strong municipal trust scores and the lowest informal sector dependency (42.3%) among all analysed jurisdictions.
Research Finding 4.1 — The Packaging Capture Problem: Packaging waste now constitutes 71–81% of all plastic waste in major cities, yet remains the most structurally difficult stream to capture. Packaging's low weight-to-volume ratio, multi-material construction (MLP), and informal-sector rejection make it the primary driver of plastic leakage into waterways and landfills. This finding directly challenges EPR compliance strategies focused on volume-based targets rather than packaging-design-adjusted targets.
EPR Risk Intelligence: Liability Geography for Plastic Packaging Industries
Earth5R's EPR Risk Multiplier framework provides plastic-packaging producers and brand owners with quantified, state-level compliance risk assessment — a critical tool for EPR budgeting, contract design, and audit planning.
EPR Risk Multipliers: Best vs. Worst Performing States
Risk multiplier of 1.0 = baseline. Each unit above 1.0 indicates proportionally higher EPR cost inflation and collection shortfall risk. Source: Earth5R EPR Intelligence Dataset, 2025.
EPR Risk Components: Delhi vs. Arunachal Pradesh
Radar comparison of the six friction dimensions that compose the EPR Risk Multiplier. Higher scores = higher friction and risk. Scores normalised 0–100.
State EPR Risk Intelligence Scorecard (Select States, 2025)
| State / UT | EPR Risk Multiplier | Avg EPR Price (₹/t) | Collection Yield | Recycling Yield | Leakage Risk | Informal Dependence | Policy Readiness | Confidence | Viability Band |
|---|---|---|---|---|---|---|---|---|---|
| Delhi | 1.02 | ₹15,241 | 91.4% | 88.2% | 9.1% | 42.3% | 82.1 | High | Stable |
| Kerala | 1.03 | ₹14,980 | 93.1% | 90.3% | 7.8% | 45.8% | 84.6 | High | Stable |
| Chandigarh | 1.06 | ₹15,111 | 92.3% | 89.1% | 9.7% | 43.9% | 79.8 | High | Stable |
| Goa | 1.08 | ₹15,431 | 90.6% | 87.4% | 11.3% | 47.6% | 73.9 | Medium | Stable |
| Maharashtra | 1.22 | ₹16,450 | 81.4% | 77.6% | 17.2% | 58.4% | 64.2 | Medium | Moderate Risk |
| Andhra Pradesh | 1.18 | ₹15,980 | 86.0% | 83.0% | 16.8% | 55.3% | 67.8 | Medium | Moderate Risk |
| Bihar | 1.34 | ₹17,120 | 76.0% | 71.0% | 22.6% | 64.5% | 48.2 | Medium | High Risk |
| Assam | 1.42 | ₹17,840 | 73.0% | 68.0% | 24.9% | 67.8% | 44.1 | Low–Med | High Risk |
| Arunachal Pradesh | 1.57 | ₹18,920 | 68.0% | 62.0% | 29.7% | 76.4% | 38.2 | Low | High Risk |
| Ladakh | 1.60 | ₹19,140 | 66.0% | 60.0% | 31.2% | 82.1% | 35.6 | Low | High Risk |
1.02 – 1.10
Delhi, Kerala, Chandigarh, Goa. Strong municipal infrastructure, high policy readiness, lower informal dependence. Brands operating here face minimal EPR cost inflation and can credibly claim verified collection at competitive EPR rates.
1.11 – 1.40
Maharashtra, Andhra Pradesh, Bihar, UP, MP. Substantial collection infrastructure exists but quality is inconsistent. EPR contracts should include verification intensity scores of 60+ and include performance bonds. Cost inflation of 18–30% should be modelled.
1.41 – 1.60+
Northeast states, Ladakh, island territories. Remoteness, minimal formal collection, high rejection rates, and extreme seasonal volatility make EPR compliance highly uncertain. Leakage probability exceeds 25–31%. Requires direct intervention investment, not broker-mediated EPR.
Research Finding 5.1 — EPR Cost Inflation Risk: The EPR Risk Multiplier framework reveals that a plastic-packaging brand operating equally across all 36 Indian states should budget for an average EPR cost inflation of 18–38% above baseline depending on geographic mix. Brands concentrated in the Northeast or island territories face structural EPR compliance gaps that cannot be resolved through credit purchase alone — they require direct programme investment to achieve verifiable collection.
Behavioural Science: The Human Dimension of Plastic Waste Management
Effective EPR and plastic waste programmes depend not just on infrastructure, but on durable behaviour change. Earth5R's longitudinal behavioural dataset across 1.2 million citizens reveals the precise dynamics of habit formation, participation decay, and community trust in India's waste ecosystem.
Behavioural Risk Index by State Category (2025)
States classified by behavioural risk level. Critical states require intensive, long-term engagement investment to achieve durable participation.
Segregation Consistency vs. Municipal Trust Score
Cross-sectional correlation between municipal trust and segregation consistency (2025). Higher trust → faster habit formation and lower decay rates.
Key Behavioural Pattern Analysis — Expert Interpretation
| Behavioural Pattern | Data Signal (2025) | Expert Interpretation | Corporate Implication |
|---|---|---|---|
| Segregation consistency improves slowly, non-linearly | Median household consistency rose ~64% (2015) to ~69% (2025); stagnation in large states | Awareness campaigns work but behaviour change is incremental and fragile | Redesign packaging to be simpler to segregate; fund continuous engagement, not pilots |
| Participation decay remains high | 12-week drop >25% in Bihar, MP, NE states even in 2025 | Programmes fail not at launch, but at month 2–3 | Brands must fund long-term engagement with retention-based KPIs |
| Awareness–action gap persists | Gap remains 18–25% in several large states in 2023–25 | Information is not the bottleneck; convenience and trust are | Reduce material ambiguity; align collection with household routines |
| Habit formation time shortens only in high-trust states | Odisha, Kerala, Haryana reach ~20–23 days; others stay ~30–38 days | Governance quality directly impacts behaviour speed | Prioritise programme deployment in high-trust municipal zones for fastest scale-up |
| Language and cultural response is a material variable | Cultural response scores range 47–78 across states | Generic programmes underperform; localisation is a multiplier | EPR programme design must incorporate linguistically adapted communications |
| Community champions accelerate outcomes | Champion density of 2+ per 10k households correlates with 12% higher consistency | Peer influence is the most cost-effective behaviour lever | Invest in community champion networks as EPR programme infrastructure |
Research Finding 6.1 — The Participation Decay Crisis: The most underappreciated risk in India's plastic waste system is participation decay — the phenomenon by which over a quarter of programme participants disengage within 12 weeks of enrolment. In 14 states, decay rates exceed 30%, effectively neutralising the impact of awareness investment within one quarter. For plastic-packaging brands funding EPR programmes, this means that one-time or pilot investments cannot generate verifiable, sustained collection data. Multi-year, retention-optimised community engagement is the minimum viable investment threshold for credible EPR credit generation.
The Informal Sector: India's Critical — and Ungoverned — Circular Economy Node
India's informal waste economy recovers an estimated 62.9% of all recyclable plastic — yet operates outside EPR accountability systems, creating systemic verification gaps and market distortions that threaten long-term compliance credibility.
Informal Sector Material Preference Profile
Relative preference of waste pickers for different plastic streams. PET and metals command highest value; MLP and flexible formats are actively rejected. Source: Earth5R Informal Sector Behaviour Dataset, 2025.
Waste Rejection Rate vs. EPR Risk Multiplier
Strong positive correlation: states with highest informal sector rejection rates also show highest EPR non-compliance risk. The informal sector's selective recovery creates structural plastic leakage.
What Informal Workers Collect
High-value streams with active market demand:
- PET Bottles — highest preference, stable market price
- HDPE Rigid containers — well-established MRF acceptance
- Metals — premium secondary market pricing
- Glass — regional market acceptance
- PP Rigid — solid informal sector preference
What Gets Left Behind
Low/negative value streams rejected by informal workers:
- Multi-Layer Packaging — near-zero recovery rate nationally
- LDPE Film — low density, poor economics
- Flexible PP — market fragmentation, contamination risk
- Tetra Pak composites — complex laminate, few takers
- Soiled packaging — contamination makes recovery unviable
Structural Vulnerabilities
Systemic fragilities in informal system reliance:
- Avg. seasonal income volatility: 22.9–34.5% by state
- Avg. rejection rate: 28–41% in high-risk states
- No verification protocol for EPR credit attribution
- COVID-19 caused complete informal sector collapse in 2020
- No formal contract or performance accountability
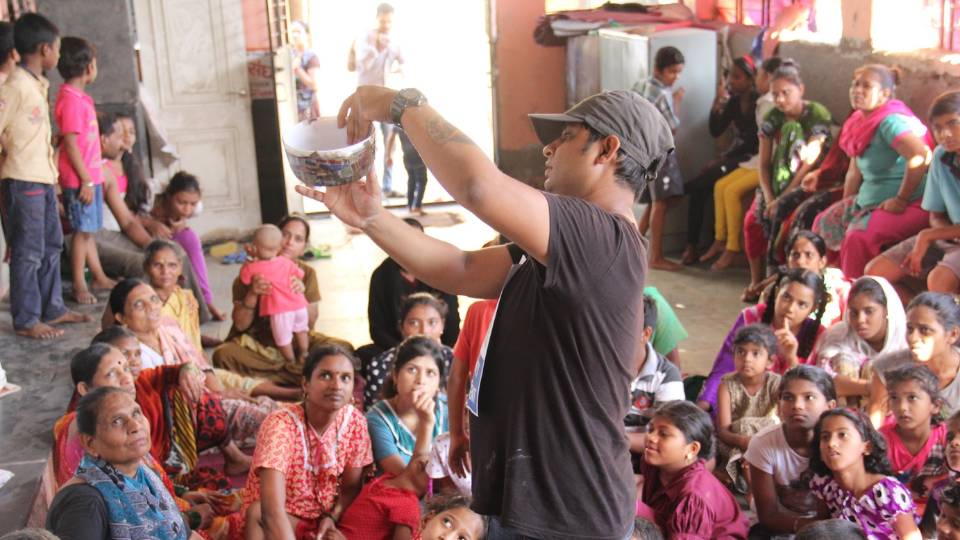
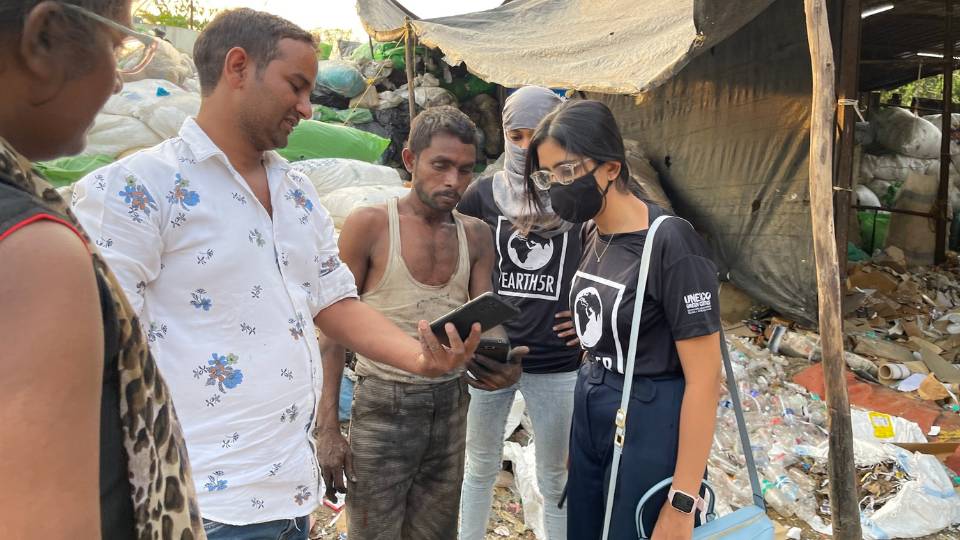
Understanding and respecting the informal sector's role is central to Earth5R's approach — the data in this report could not exist without their cooperation and trust.
Research Finding 7.1 — The MLP Accountability Gap: Multi-layer packaging — the fastest-growing plastic stream — has a rejection rate approaching 100% by the informal sector in most states, and insufficient formal processing capacity to absorb the volume. This creates a structural accountability gap in EPR systems: brands producing MLP cannot credibly claim collection credit through either formal or informal channels in most states, making MLP the highest-risk packaging format from an EPR compliance perspective. Earth5R recommends that MLP packaging be explicitly assessed at a risk premium of 1.5–2.0× in EPR cost modelling.
Earth5R Intervention Impact: 2015–2025 ESG Outcomes
Earth5R's direct programme interventions, combined with the forensic data infrastructure developed through SaaS-X, have generated quantified, auditable environmental, social, and economic outcomes across the study period.
(2015–2023 direct programme)
Plastic Recycling (2015–2023)
Materials (2015–2023)
Cumulative ESG Impact Metrics (2015–2025)
Year-on-year accumulation of Earth5R's direct programme outcomes. Includes waste diverted, CO₂ avoided, and economic value created from recycling operations.
🌱 Environmental KPIs
👥 Social KPIs
⚡ Governance & Economic KPIs
The People Behind the Numbers
Every tonne diverted, every data point verified, every habit formed — all of it traces back to the Earth5R team and the 1.3 million citizens who made it real.

"The Earth5R team did not simply study India's plastic waste problem — they built the human infrastructure to solve it, one community at a time."
Corporate ESG Value Proposition
Verified EPR Compliance
Earth5R's forensic audit infrastructure provides third-party verifiable evidence of plastic waste collection, segregation, and recycling — the evidentiary standard required by CPCB EPR regulations and increasingly demanded by institutional investors and ESG rating agencies.
Risk-Adjusted EPR Budgeting
The EPR Risk Multiplier framework enables plastic-packaging producers to accurately model state-level compliance costs, avoiding chronic under-budgeting for high-risk geographies and allowing strategic deployment of EPR investment where collection efficiency is highest.
Packaging Design Intelligence
Field data on informal sector rejection rates and MRF acceptance provides direct feedback on packaging design decisions. Brands can use this intelligence to quantify the recyclability premium or discount of their specific packaging formats before EPR cost modelling.
Community Carbon Co-Benefits
Earth5R programmes generate co-auditable carbon offset evidence (1.5 tCO₂ per tonne of plastic recycled) alongside primary EPR outcomes, providing plastic-packaging companies with dual ESG reporting evidence for scope 3 emissions reduction initiatives.
Circular Economy Integration
By channelling recovered materials back into production supply chains with documented provenance, Earth5R's programmes directly support circular economy reporting under GRI 306, BRSR Principle 2, and EU Corporate Sustainability Reporting Directive (CSRD) emerging requirements.
Behavioural Change as Shared Value
Long-term community engagement programming creates measurable, lasting changes in waste disposal behaviour that reduce downstream collection costs, improve MRF input quality, and generate positive brand equity in communities where plastic-packaging companies operate.
Conclusions & Strategic Recommendations
The 2015–2025 longitudinal dataset provides actionable intelligence for plastic-packaging industries navigating India's evolving EPR regulatory landscape. The following evidence-based recommendations emerge from the forensic analysis.
Key Research Conclusions
- Plastic packaging is now the dominant waste challenge in India's urban centres, constituting 71–81% of all plastic waste in mature cities. Volume-based EPR targets that don't account for packaging-type-adjusted recoverability are structurally inadequate.
- Multi-layer packaging represents an existential EPR compliance risk. With informal sector rejection approaching 100% and formal processing capacity insufficient, MLP producers face the highest leakage-adjusted EPR cost burden of any packaging format.
- COVID-19 demonstrated that India's plastic collection infrastructure is fragile — segregation rates collapsed 16.7 percentage points in 2020. EPR programmes must include resilience provisions and diversified collection channels.
- Behaviour change requires a minimum 20–38 day reinforcement investment to achieve habituation, and 27% of participants disengage within 12 weeks. EPR compliance programmes funded on pilot-timescales will systematically underperform.
- Governance quality is the primary predictor of EPR success. Municipal trust scores above 65/100 correlate with segregation consistency exceeding 70% and habit formation under 25 days — demonstrating that infrastructure investment without governance reform has limited returns.
- The informal sector is simultaneously India's most important and most fragile circular economy node. Its selective recovery of high-value plastics subsidises formal EPR systems, while its categorical rejection of MLP and flexible packaging creates invisible leakage at scale.
Strategic Recommendations for Industry
- Adopt EPR Risk Multiplier-adjusted budgeting — allocate 18–38% additional EPR cost contingency for states with multipliers above 1.3, and negotiate verification clauses into all EPR service contracts.
- Prioritise recyclable packaging design — engage Earth5R's Packaging Design Intelligence service to quantify recoverability scores before launch. MLP format adoption should be modelled with full EPR cost-adjusted lifecycle analysis.
- Fund multi-year community engagement, not pilots — minimum 18-month engagement cycles with retention-based KPIs (not launch attendance) are necessary for verifiable segregation data generation.
- Formalise informal sector relationships — direct contractual relationships with waste picker cooperatives, with GPS-tracked collection data and material provenance documentation, provide the strongest EPR verification evidence base.
- Integrate forensic audit data into ESG disclosure — Earth5R's forensic characterisation reports provide CPCB-aligned evidence for EPR annual reports and the evidentiary standard emerging under SEBI BRSR Core requirements.
- Deploy the EPR Risk Multiplier to prioritise intervention geography — brands with national distribution should concentrate direct EPR programme investment in states with multipliers above 1.3 to reduce systemic leakage, while leveraging aggregator markets in low-risk states.