
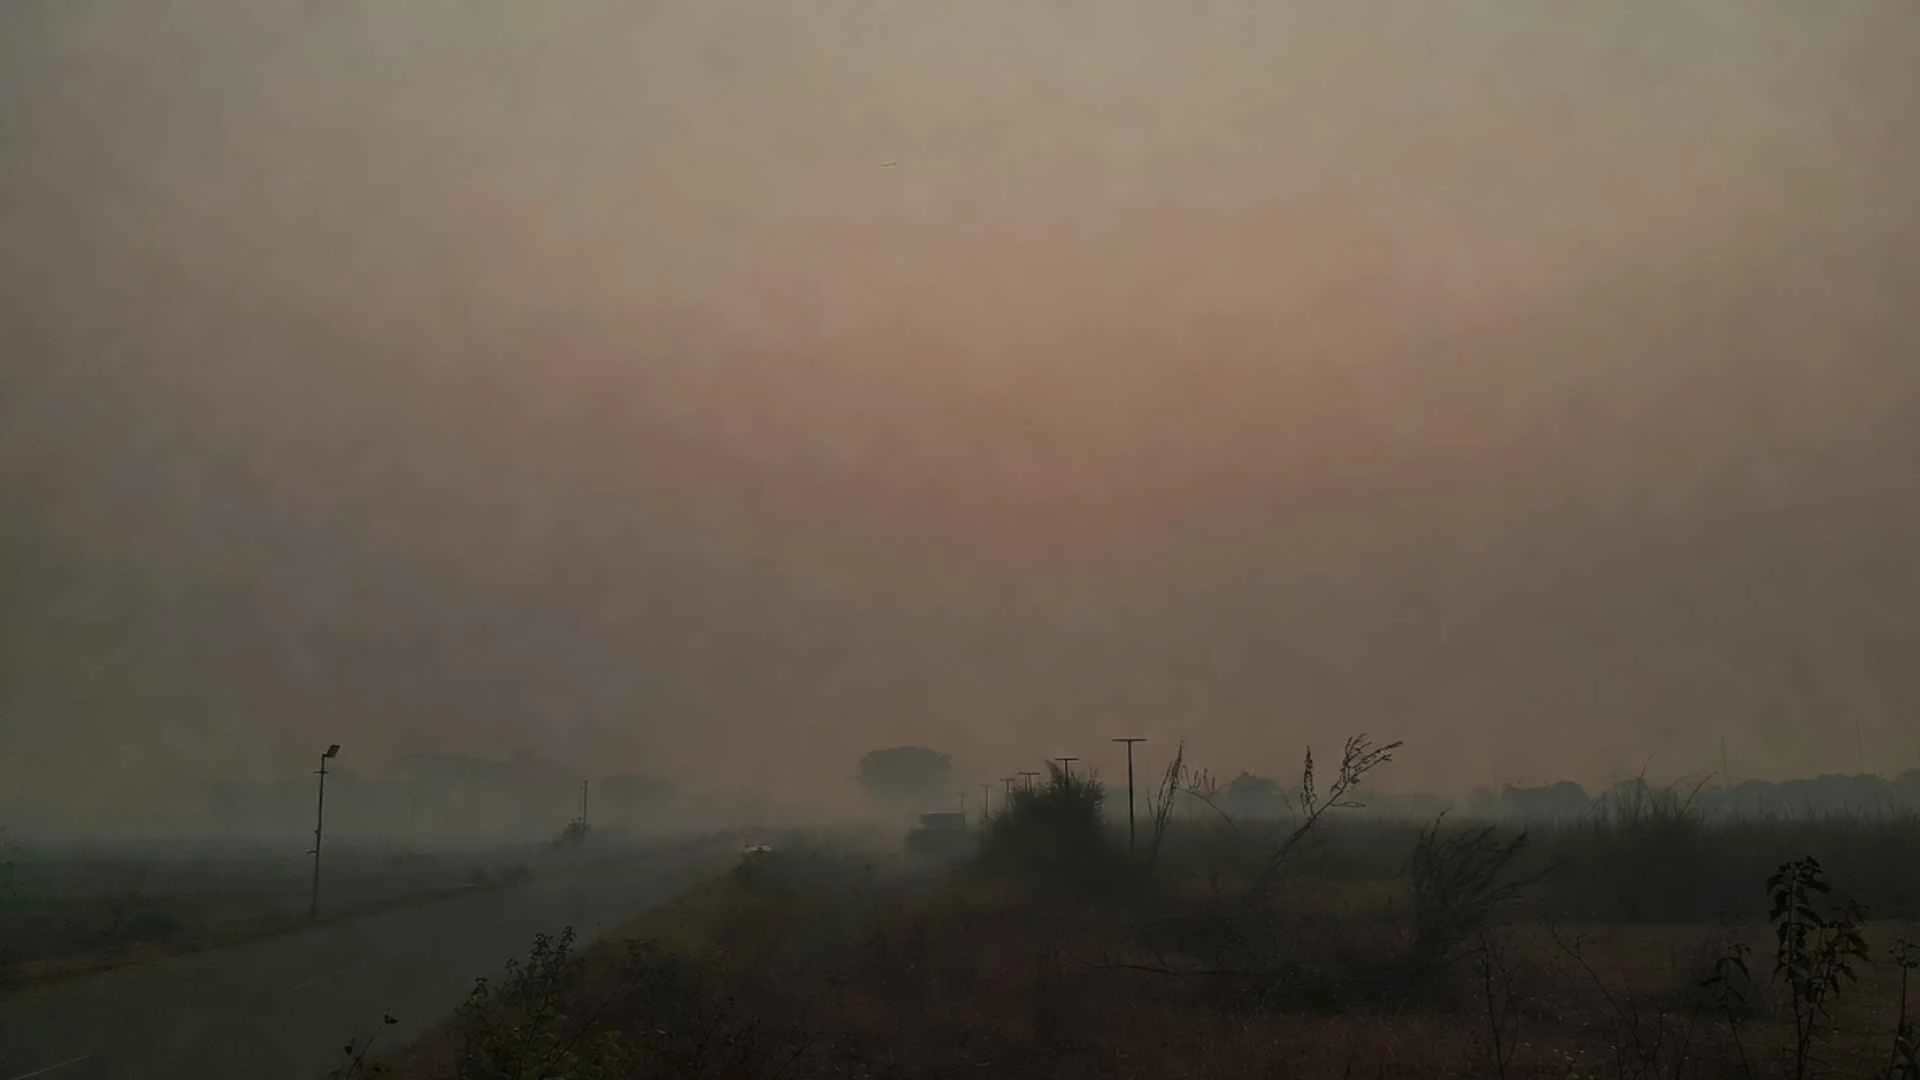
India has some of the dirtiest air on the planet, and the evidence on what it costs keeps growing. These ten facts, drawn from the latest independent research, show where the air is worst, what fouls it, who pays, and which measures have cut pollution elsewhere.
The ten facts at a glance
- No Indian breathes air that meets the WHO guideline
- Indian cities hold five of the world’s ten worst places
- More than 2 million deaths a year
- 3.5 years of life lost, and 8.2 in Delhi
- Fossil fuels and burning biomass share the blame
- Delhi had seven clean-air days all winter
- Farm fires fell 93% in Punjab, and smoke still arrives
- Garbage fires are one of the quickest sources to stop
- Toxic air costs the equivalent of 9.5% of GDP
- Most clean air money has gone to road dust
For the full picture of policy, the winter outlook and community action, read our long-form analysis, India Air Pollution 2026: 2 Million Deaths and the Case for Community-Led Action.
01
No Indian breathes air that meets the WHO guideline
IQAir’s 2025 World Air Quality Report ranks India sixth most polluted of 143 countries, with a national average PM2.5 concentration of 48.9 micrograms per cubic metre (µg/m³), slightly down from 50.6 µg/m³ in 2024.[1] IQAir has said the dip is not statistically significant.
The World Health Organization’s guideline for annual PM2.5 is 5 µg/m³.[15] India’s own national standard is 40 µg/m³, eight times weaker, and much of the country fails even that. The Air Quality Life Index finds that every one of India’s 1.4 billion people lives where pollution is above the WHO line.[2] In the winter of 2025–26, not one of the 238 cities CREA analysed met it.[6]
PM2.5 is the fine dust and soot under 2.5 micrometres across, about thirty times thinner than a human hair. It travels deep into the lungs and crosses into the blood, which is why it is the measure that matters most for health.
Exposure in India is close to universal. Health and productivity risk from air applies to every site and every workforce, including offices in the cleaner southern cities.
02
Indian cities hold five of the world’s ten worst places
Loni, a town of about 700,000 people in Ghaziabad district, was the most polluted city in the world in 2025, at 112.5 µg/m³, more than 22 times the WHO guideline.[1][17] Factory fumes, traffic, construction dust and broken roads all feed it. Byrnihat, on the Assam–Meghalaya border, ranked third, Delhi fourth, Ghaziabad seventh and Ula tenth. In all, 66 of the world’s 100 most polluted cities were Indian, and New Delhi was the most polluted capital for the eighth year running, at 82.2 µg/m³.[1][18]
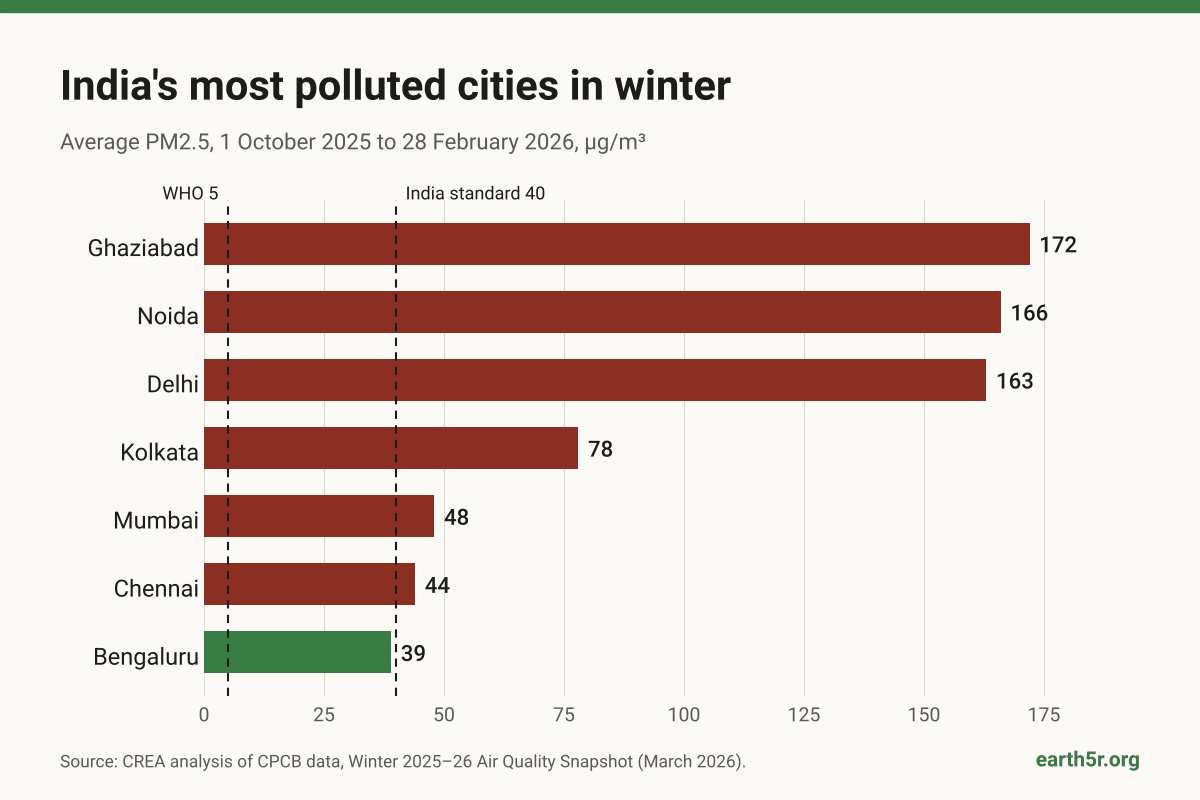
Winter widens the gap between north and south. CREA’s analysis of official monitoring data from October 2025 to February 2026 shows the National Capital Region at the top and Bengaluru as the only megacity below the national standard.[6]
Average PM2.5 in winter 2025–26, µg/m³
1 October 2025 to 28 February 2026. Dashed lines mark India’s standard (40) and the WHO guideline (5).
Source: CREA analysis of CPCB data, Winter 2025–26 Air Quality Snapshot.[6] The cleanest city in the analysis was Chamarajanagar in Karnataka, at 19 µg/m³.
City choice is an air quality decision. A plant, campus or warehouse in the National Capital Region breathes about four times the PM2.5 of one in Chennai or Bengaluru through the winter.
03
Air pollution is linked to more than 2 million deaths a year
The State of Global Air 2025 report, from the Health Effects Institute and the Institute for Health Metrics and Evaluation, attributes more than 2 million deaths in India in 2023 to air pollution, up 43% since 2000.[3] India’s air pollution death rate is about 186 per 100,000 people, against 17 in high-income countries, and nearly nine in ten of these deaths come from heart disease, stroke, lung disease, diabetes and other non-communicable diseases.[3]
The Lancet Countdown counts only the fine particles that human activity puts into the air, and arrives at a similar figure: 1.72 million deaths in 2022, up 38% since 2010.[5]
Air quality is now a brain health issue as well as a heart and lung issue. For employers and insurers, it shows up as illness, absence and long-term health costs across the whole working population.
04
The average Indian loses 3.5 years of life, and Delhi residents 8.2
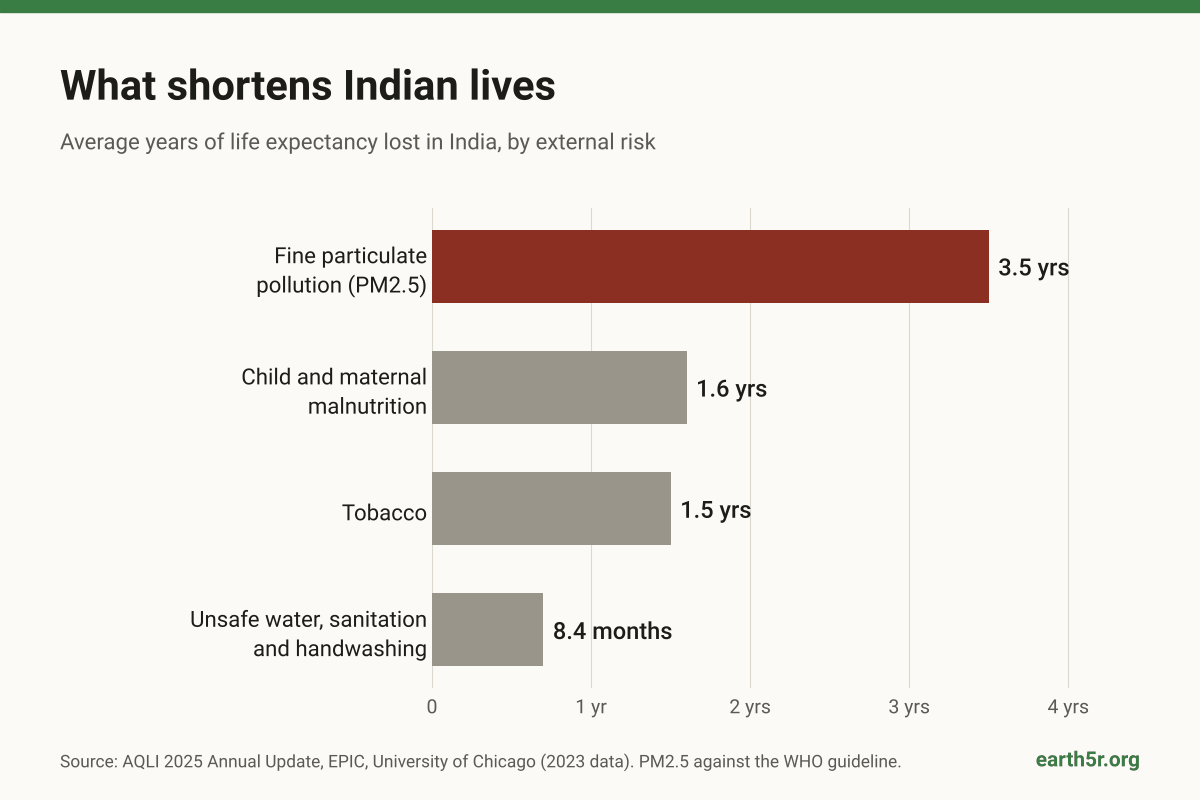
The Air Quality Life Index, from the Energy Policy Institute at the University of Chicago, estimates that the average Indian would live 3.5 years longer if the air met the WHO guideline.[2] No other external risk to Indian life expectancy comes close.
What shortens Indian lives
Average years of life expectancy lost in India, by external risk
Source: AQLI 2025 Annual Update, 2023 data. PM2.5 measured against the WHO guideline.[2]
The toll is heaviest in the north. Residents of Delhi would gain 8.2 years, the largest potential gain anywhere in the world, followed by Bihar (5.6 years), Haryana (5.3) and Uttar Pradesh (5.0). The Northern Plains, home to 544.4 million people or 38.9% of India’s population, average 5 years.[2] These are estimates of what a lifetime at a given year’s pollution level would cost, so they measure what clean air would give back.
On this measure, cleaning the air would add more years to Indian lives than ending tobacco use and malnutrition combined.
05
Fossil fuels and burning biomass share the blame
The Lancet Countdown traces the 1.72 million deaths from human-made PM2.5 in 2022 back to the fuels behind them. Fossil fuels account for 44%. Coal alone is linked to 394,000 deaths, 298,000 of them from power plants, and petrol burned in road transport to 269,000.[5] Most of the rest comes from wood, dung and crop waste burned in homes and fields, open waste burning, and dust.
Two policy moves pull in opposite directions. In July 2025 the Environment Ministry exempted 462 of about 600 coal generating units from sulphur dioxide limits.[19] A CREA analysis in July 2026 found that at least 81% of the sulphur dioxide from coal plants within 300 km of Delhi-NCR comes from exempted units.[7] In homes, the Pradhan Mantri Ujjwala Yojana has put LPG within reach of millions of poor families, and the household air pollution death rate fell 64% between 1990 and 2019.[10] The harder task is affordable refills, so the wood stove stays cold.
For a plain-language primer on each source, see Earth5R’s guide to the 8 major sources of air pollution.
There is no single fix. Power, transport, household fuel, agriculture and waste each need their own plan, and a city plan that tackles only one of them will stall.
06
Delhi had seven clean-air days all winter
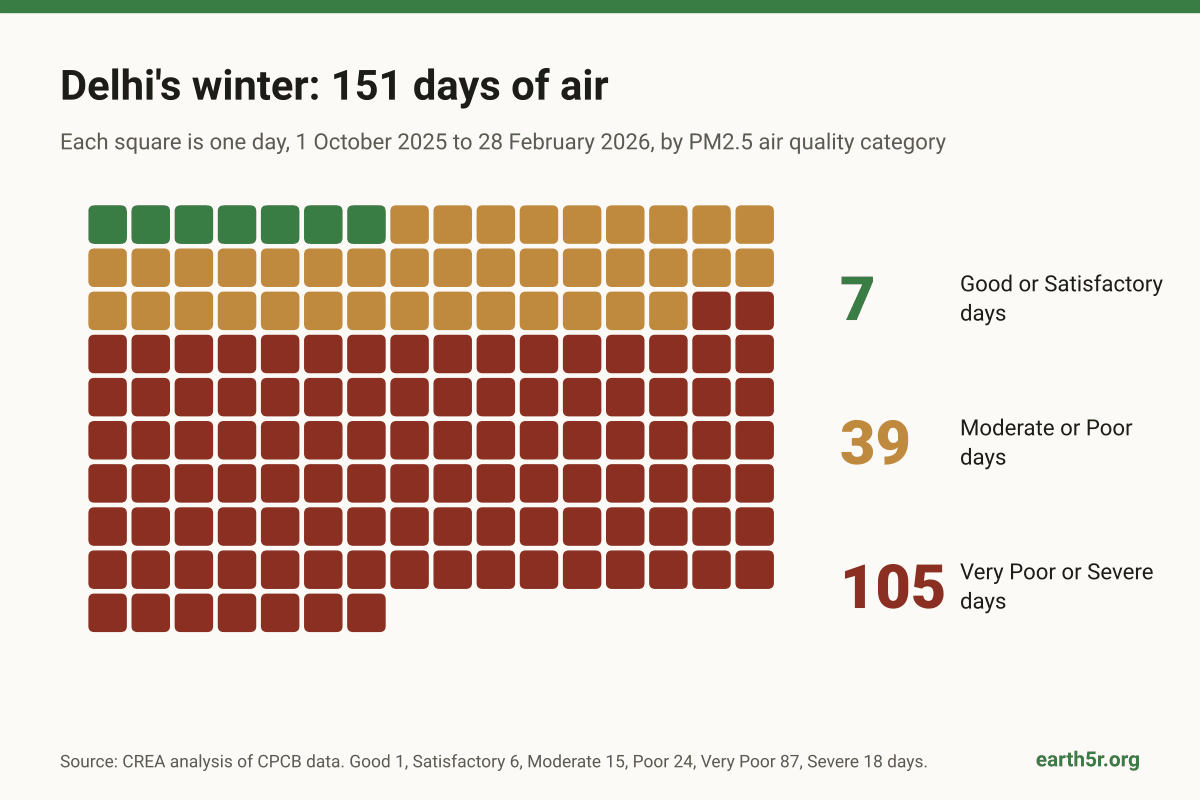
Between 1 October 2025 and 28 February 2026, Delhi averaged 163 µg/m³ of PM2.5. Of its 151 winter days, 105 were Very Poor or Severe, and just seven were Satisfactory or Good.[6]
Delhi’s winter, one square per day
1 October 2025 to 28 February 2026, by PM2.5 air quality category
Source: CREA analysis of CPCB data.[6] Full count: Good 1, Satisfactory 6, Moderate 15, Poor 24, Very Poor 87, Severe 18.
Geography does much of the damage. The Indo-Gangetic Plain is a basin closed by the Himalayas to the north, and in winter, cold still air settles over it like a lid and traps smoke close to the ground. The worst stretch usually runs from mid-October to mid-November, when crop fires, falling temperatures and festival fireworks arrive together. Across the country, 204 of 238 cities exceeded the national standard last winter, up from 173 the winter before.[6]
The year as a whole is slowly improving. Delhi recorded 200 days with an AQI below 200 in 2025 (to the end of November), against 110 in 2016.[16] This year Diwali falls on 8 November, deep inside the peak window. On 1 October 2026 the Supreme Court ruled out both a total firecracker ban and unrestricted bursting, and said it would decide which crackers to allow after a CPCB report due by 15 October.[14]
For organisations in north India, October to February is the time for indoor air plans, flexible hours, outdoor work limits and health checks. Delhi-NCR’s emergency plan, GRAP, can restrict construction and freight with little notice.
07
Farm fires fell 93% in Punjab, but the smoke has not gone away
Official counts made 2025 the cleanest crop-burning season in more than a decade. Punjab logged 5,114 farm fires between 15 September and 30 November, 53% fewer than in 2024 and 93% fewer than in 2021. Haryana logged 662.[8]
Read those counts with care. Satellite analysis featured by NASA’s Earth Observatory suggests burning has shifted to later in the day, after the satellites behind the official counts have passed, and that 2025 activity was mid-range rather than a record low.[9] The lasting fix is to make straw worth more than a match: Punjab and Haryana have received more than ₹3,120 crore since 2018–19 for residue machines, and brick kilns outside the NCR must co-fire pellets made from paddy straw, rising from 20% now to 50% by 2028.[8]
Straw is becoming a raw material. Pellet makers, biomass power, packaging and brick kilns can buy it, and companies with agricultural supply chains can help make that market. Earth5R works on this with agriculture and industry partners.
08
Garbage fires are one of the quickest sources to stop
Burning garbage releases black carbon, dioxins and heavy metals at street level, where people breathe. Open burning has been banned under the Solid Waste Management Rules since 2016, and the SWM Rules 2026 add four-stream segregation at source. It is still common wherever collection is irregular.
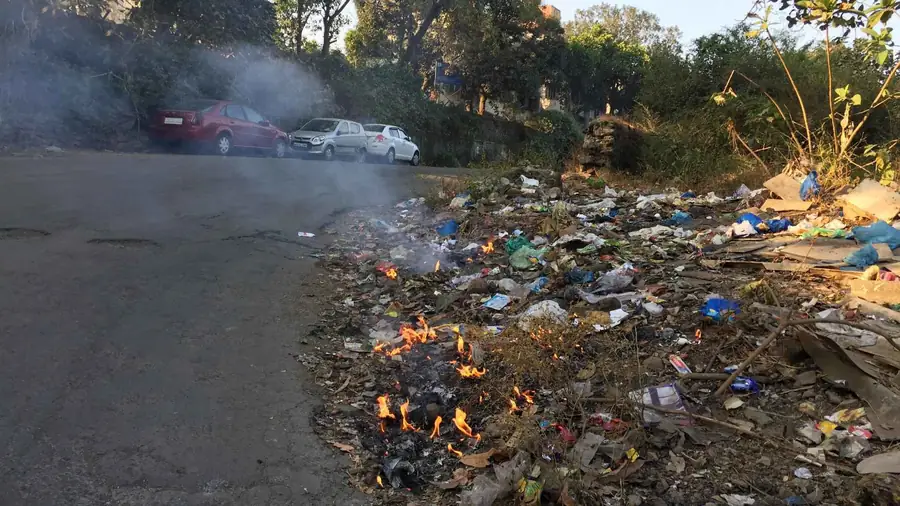
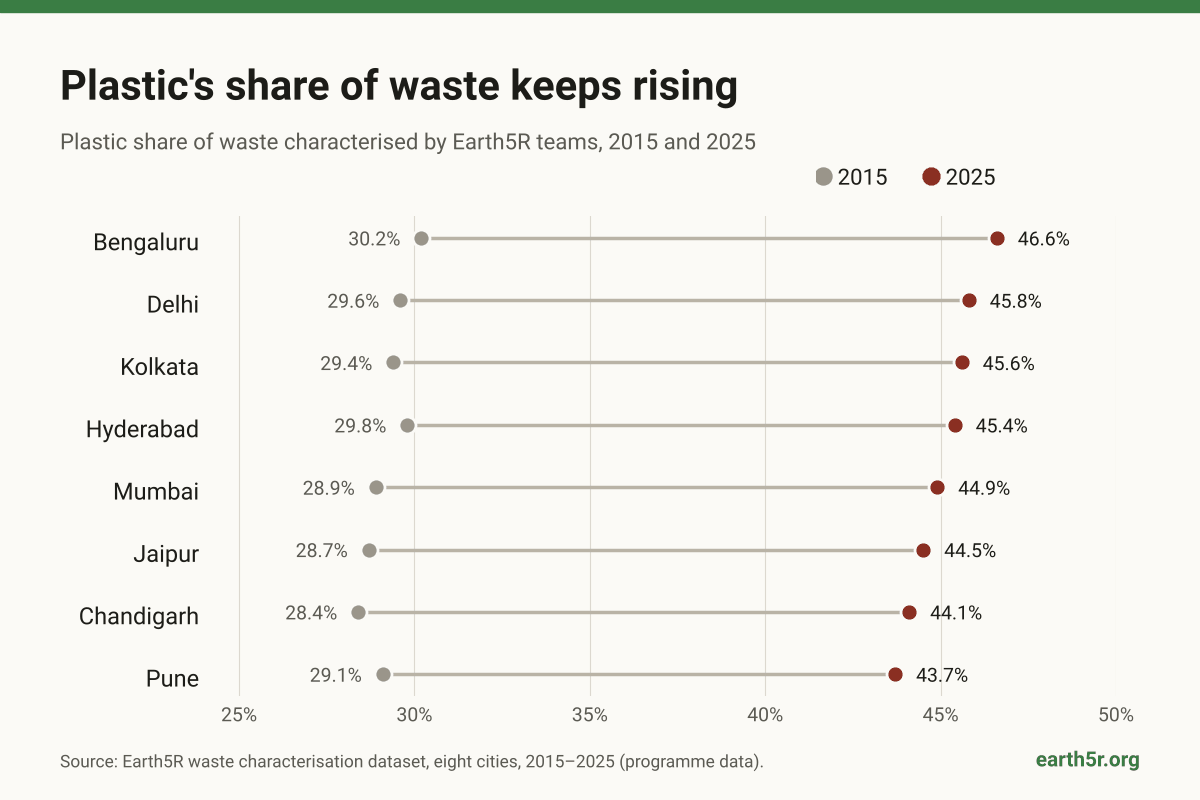
What burns is changing. In waste characterised by Earth5R teams in eight cities, plastic’s share rose from about 29% in 2015 to about 45% in 2025, and most of that plastic was packaging.[11] Burning plastic adds dioxins and other toxic compounds to the smoke.
Plastic share of characterised waste, 2015 and 2025
Per cent of waste by weight, Earth5R field characterisation
Source: Earth5R waste characterisation dataset, 2015–2025.[11] Programme data from Earth5R project areas, not city-wide totals.
Earth5R’s field experience is that burning follows gaps in collection and missing segregation.[12] When a neighbourhood has reliable doorstep collection and a place for dry waste to go, the reason to light a heap disappears.
Waste collection is clean air work. Housing societies, municipal wards and companies funding plastic recovery under Extended Producer Responsibility can cut street-level smoke within months, without waiting for national policy.
09
Toxic air costs India the equivalent of 9.5% of GDP
The Lancet Countdown values premature deaths from outdoor air pollution in India at US$339.4 billion in 2022, equal to 9.5% of GDP, or about ₹26.7 lakh crore at 2022 exchange rates.[5] That figure puts the value of lives cut short on the same scale as national output. A narrower measure, which counts only lost production from death and illness, put the loss at US$36.8 billion, or 1.36% of GDP, in 2019.[10]
Lower-income states lose the largest share of their output. After Uttar Pradesh came Bihar (1.95%), Rajasthan (1.70%), and Madhya Pradesh and Chhattisgarh (1.55% each). Delhi had the highest loss per person, at US$62.[10]
Air pollution is a workforce and productivity risk, and it belongs in climate risk assessments, BRSR employee wellbeing disclosures and site selection, alongside heat and water.
10
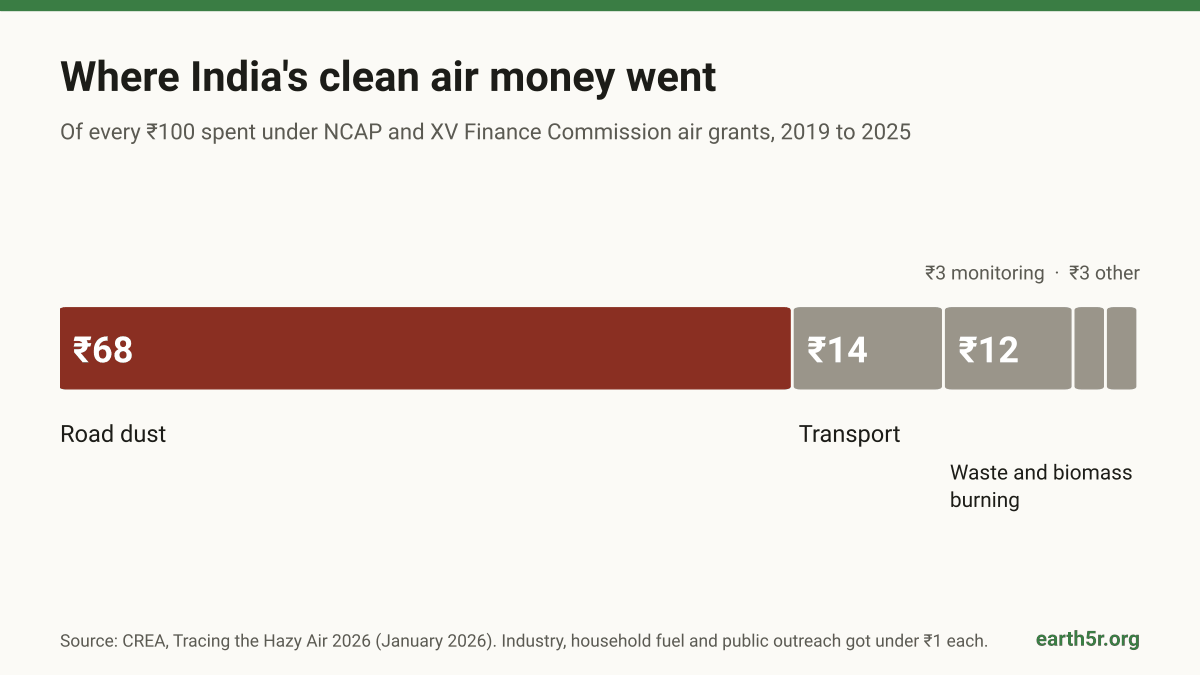
Most clean air money has gone to road dust
Since 2019, ₹13,415 crore (about US$1.4 billion) has been released under the National Clean Air Programme (NCAP) and the XV Finance Commission’s air quality grants, and ₹9,929 crore, 74%, has been used.[7] Spending has gone mostly to one source.
Where India’s clean air money went
Of every ₹100 spent under NCAP and XV Finance Commission air grants, 2019 to 2025
Source: CREA, Tracing the Hazy Air 2026.[7] Industry, household fuel and public outreach received under ₹1 each.
The reason is the yardstick. NCAP judges cities on PM10, the coarser particle, so money flows to road sweeping and dust control, while the combustion sources that drive PM2.5 receive far less. Of the 100 NCAP cities with enough data to assess, 23 met the revised target of a 40% cut in PM10, and 23 got worse.[7] India had about 1,600 monitoring stations in 2025, yet 28 of the 130 NCAP cities still had no continuous monitor.[7]
Independent reviewers, including CREA and the Centre for Science and Environment, recommend switching the benchmark to PM2.5 and funding by source. Until that happens, local action on burning, fuel and waste fills the biggest gap.
What has cut air pollution elsewhere, and in Indian neighbourhoods
Sustained national action
After declaring a “war on pollution” in 2014, China brought particulate pollution in 2023 to 40.8% below its 2014 level, adding about 1.8 years to average life expectancy. The United States has cut particulate pollution by more than 60% since the Clean Air Act of 1970.[2]
Public data that keeps the pressure on
In Poland, citizen groups made air data visible, and in 2016 Kraków became the first Polish city to ban solid fuels for home heating. Particulate pollution there fell 27.6% between 2016 and 2023.[2] In China, a field experiment found that public complaints about factories, made possible by real-time emissions data, brought more inspections and lower emissions.[20]
Neighbourhood action in India
Pollution is local, so Earth5R works at the scale of the neighbourhood. Volunteers measure air quality with the Earth5R app, map visible sources such as waste fires and construction dust, and work with residents and municipal teams to fix collection so that waste stops being burned.[12] Between 2022 and 2024, volunteers recorded PM2.5 levels 15–25% lower in neighbourhoods with community monitoring and waste interventions than in comparable areas without them.[12] Earth5R’s Climate Change Training Framework has trained 23,870 people on air pollution, waste and sustainability practice.[13]
About these figures. The 15–25% result comes from volunteer readings with the Earth5R app and is programme-reported. It has not been peer reviewed, and the comparison areas were not randomly assigned. It is offered as evidence that community data is worth collecting and testing, and Earth5R is open to sharing it with researchers.
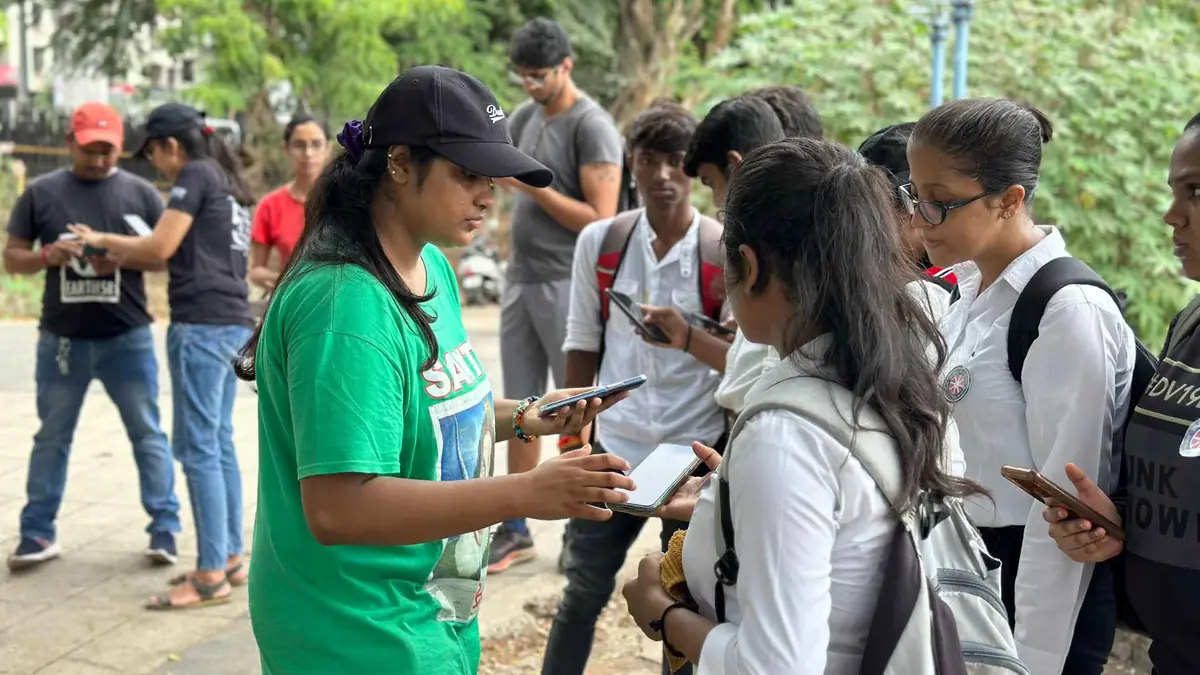
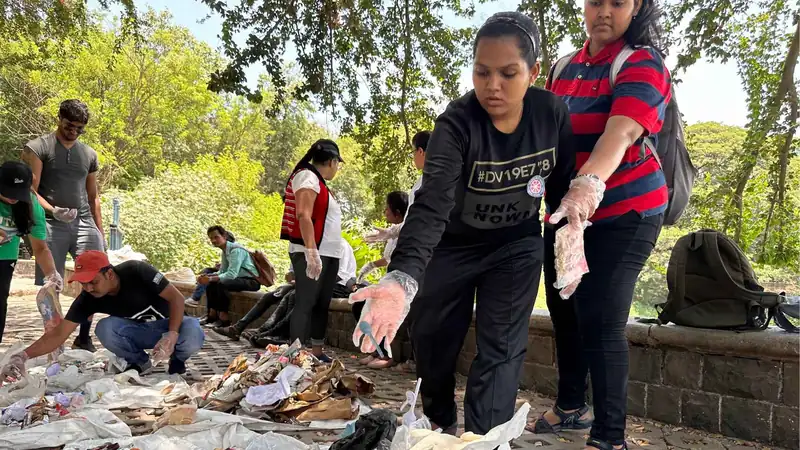
For companies, CSR teams and city agencies, the practical offer is neighbourhood-level air and waste data, trained local volunteers and waste systems in the places where their people and operations are. Read more about the Air Quality Improvement Framework.
Infographics from this article
Free to use in reports, presentations and posts with credit to Earth5R and a link to this page. Select an image to open the full size.
Frequently asked questions
- Which is the most polluted city in India?
- On the annual average, Loni in Ghaziabad district, at 112.5 µg/m³ of PM2.5 in 2025, which also made it the most polluted city in the world.[1] Over winter 2025–26, Ghaziabad had the highest average, at 172 µg/m³.[6]
- What are the main causes of air pollution in India?
- Coal burned in power plants and industry, vehicle exhaust, wood, dung and crop waste burned in homes, crop residue fires, open waste burning, and construction and road dust. Fossil fuels account for 44% of deaths from human-made PM2.5.[5]
- How many people die from air pollution in India?
- More than 2 million in 2023, according to State of Global Air 2025.[3] The Lancet Countdown, which counts only human-made fine particles, puts the figure at 1.72 million for 2022.[5]
- Which Indian city has the cleanest air?
- In CREA’s winter 2025–26 analysis, Chamarajanagar in Karnataka was cleanest, at 19 µg/m³, and Bengaluru was the only megacity below the national standard, at 39 µg/m³. No city met the WHO guideline.[6]
- When is air pollution worst in India?
- From October to February, and especially from mid-October to mid-November in the north, when crop fires, cold still air and festival fireworks coincide.
- What is a safe level of PM2.5?
- The WHO guideline is 5 µg/m³ as an annual average and 15 µg/m³ over 24 hours. India’s standards are 40 and 60 µg/m³.[15]
Related reading on Earth5R
- India Air Pollution 2026: 2 Million Deaths and the Case for Community-Led Action
- 8 Major Sources of Air Pollution
- Earth5R’s Air Quality Improvement Framework through Citizen-Led Monitoring
- Why India’s Air Crisis Needs Local Solutions, Not Imported Tech
- SWM Rules 2026: India’s Four-Stream Waste Segregation Shift
References
- IQAir (2026). 2025 World Air Quality Report. March 2026. iqair.com
- Greenstone, M. et al. (2025). Air Quality Life Index 2025 Annual Update. Energy Policy Institute at the University of Chicago. aqli.epic.uchicago.edu
- Health Effects Institute and Institute for Health Metrics and Evaluation (2025). State of Global Air 2025. stateofglobalair.org
- Health Effects Institute (2024). State of Global Air 2024, with UNICEF. Under-five deaths in India, 2021. Report coverage, Scroll
- Romanello, M. et al. (2025). The 2025 report of the Lancet Countdown on health and climate change. The Lancet. India data sheet. lancetcountdown.org
- Centre for Research on Energy and Clean Air (2026). Winter 2025–26 Air Quality Snapshot, India. March 2026. energyandcleanair.org
- Centre for Research on Energy and Clean Air (2026). Tracing the Hazy Air 2026: Progress Report on the National Clean Air Programme, January 2026; and analysis of SO₂ from coal plants near Delhi-NCR, July 2026. energyandcleanair.org
- Commission for Air Quality Management (2025). Conclusion of the 2025 paddy harvesting season. Press release, 2 December 2025. Release text
- NASA Earth Observatory (2025). New Timing for Stubble Burning in India. December 2025. science.nasa.gov
- India State-Level Disease Burden Initiative Air Pollution Collaborators (2021). Health and economic impact of air pollution in the states of India: the Global Burden of Disease Study 2019. The Lancet Planetary Health. doi.org
- Earth5R. Waste characterisation dataset, eight cities, 2015–2025. Programme data.
- Earth5R. Air Quality Improvement Framework through Citizen-Led Monitoring. earth5r.org
- Earth5R. From Awareness to Action: Climate Change Training Framework. earth5r.org
- All India Radio News (2026). SC rules out total ban on firecrackers ahead of Diwali, favours balanced approach. 1 October 2026. newsonair.gov.in
- World Health Organization (2021). WHO Global Air Quality Guidelines. who.int
- Ministry of Environment, Forest and Climate Change (2025). Written replies in Parliament on Delhi air quality, December 2025.
- CNN (2026). This small city has the world’s worst air. 31 March 2026. Syndicated copy, CP24
- Drishti IAS (2026). World Air Quality Report 2025. 27 March 2026. drishtiias.com
- Ministry of Environment, Forest and Climate Change (2025). Notification amending SO₂ emission norms for coal and lignite thermal power plants. Gazette of India, 11 July 2025.
- Buntaine, M. T., Greenstone, M., He, G., Liu, M., Wang, S. and Zhang, B. (2024). Does the Squeaky Wheel Get More Grease? The Direct and Indirect Effects of Citizen Participation on Environmental Governance in China. American Economic Review.
How to cite this article
Earth5R (2026). 10 Facts About Air Pollution in India in 2026: Most Polluted Cities, Causes and What Works. EarthJournal, Earth5R, 9 October 2026. https://earth5r.org/air-pollution-in-india-facts/
Figures are taken from the sources cited and were current on 9 October 2026. Earth5R figures are programme-reported. This article is for information and is not medical advice.