
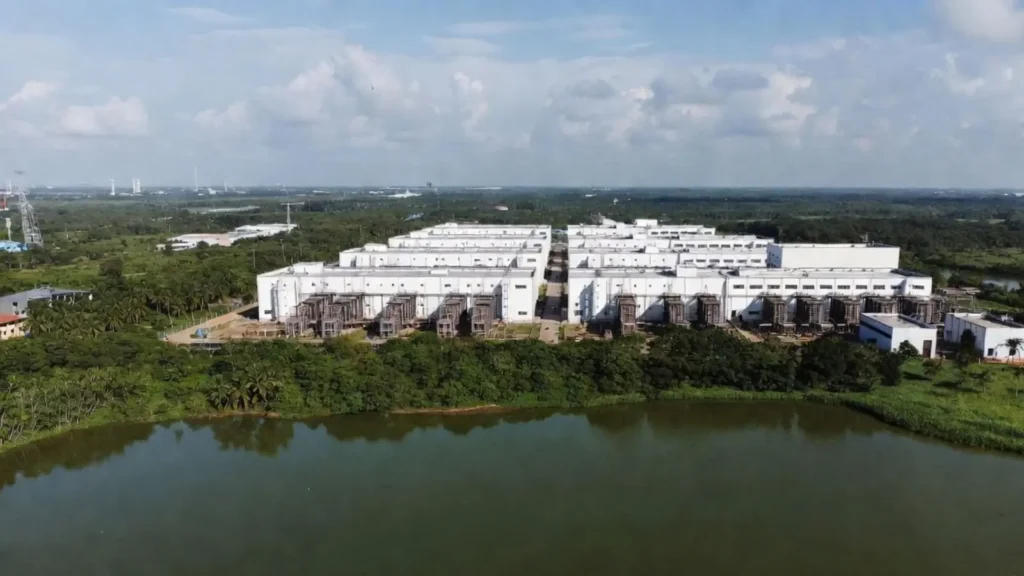
Data Centres and Water in India: Risks, Disclosure and a Community Method for Catchment Stewardship
India’s data centre capacity is set to triple or more by 2030, and much of it is clustering in cities that already struggle for water. This brief sets out what is known and what is not, how the risk appears in BRSR and ESG reporting, and a practical method for companies and communities to manage water in the catchments they share.
Abstract
Data centres are becoming one of India’s fastest-growing users of electricity and water. Installed capacity grew from about 520 MW in 2020 to about 1.5 GW in 2025 and is projected to reach 4.5–6.5 GW by 2030.[1] Water use was estimated at about 150 billion litres in 2024 and is expected to more than double by 2030.[1] About a quarter of India’s data centres are in Mumbai, with most of the rest in Chennai, Hyderabad and Bengaluru,[1] cities where households, industry and farms already compete for water.
India has no national data centre policy, no water-efficiency standard for the sector and no requirement for facilities to report their water use.[1][2] This brief reviews the evidence, maps the risk onto SEBI’s Business Responsibility and Sustainability Report (BRSR), and proposes an eight-step method for water stewardship at catchment level. It uses programme data from Earth5R’s community water work as one worked example and states the limits of that data. It closes with open questions for research.
Five findings for sustainability, ESG and CSR teams
- The risk is local before it is national. Data centres use a small share of India’s total water, but they concentrate in a few urban catchments that are already stressed. That is where the effects will be felt first.[1][2]
- The first problem is missing data. Without facility-level reporting of water withdrawal, consumption and Water Usage Effectiveness (WUE), regulators, investors and neighbours cannot see the footprint.[2]
- Cooling is a trade-off. Water-based cooling saves electricity. Air cooling saves water but uses more power, and generating that power also uses water.[1]
- For most listed companies, data centre water is a value-chain issue. BRSR’s water indicators cover a company’s own operations. The water used by its cloud, colocation and AI providers is upstream of those figures and is rarely disclosed.[6][7]
- Community work in the same catchment can offset part of the pressure, but only when it is measured by a stated method, located in the same basin and reported as water delivered rather than capacity installed.[8]
Why water, and why now
India’s digital growth has a physical base. Every payment, video call and AI query runs on servers in buildings that draw power around the clock and must shed heat continuously. A study by CEEW and SYSTEMIQ estimates that installed data centre capacity nearly tripled from about 520 MW in 2020 to almost 1.5 GW by mid-2025. Committed investment between 2019 and 2025 reached about USD 95 billion, with USD 30 billion committed in 2025 alone.[1] Electricity demand from the sector is projected to grow nearly fivefold, from about 13 TWh in 2024 to about 57 TWh in 2030.[2]
India’s installed data centre capacity
Gigawatts of IT capacity. The 2030 bar shows the projected range.
Source: CEEW and SYSTEMIQ (2026), citing JM Financial, CBRE, Colliers and S&P Global.[1]
Water follows the same curve. India’s data centres used about 150 billion litres of water in 2024, and the figure is expected to more than double by 2030.[1] For comparison, the International Energy Agency puts global data centre water use at about 560 billion litres a year.[1][3] The two estimates come from different sources and should not be combined into a share.
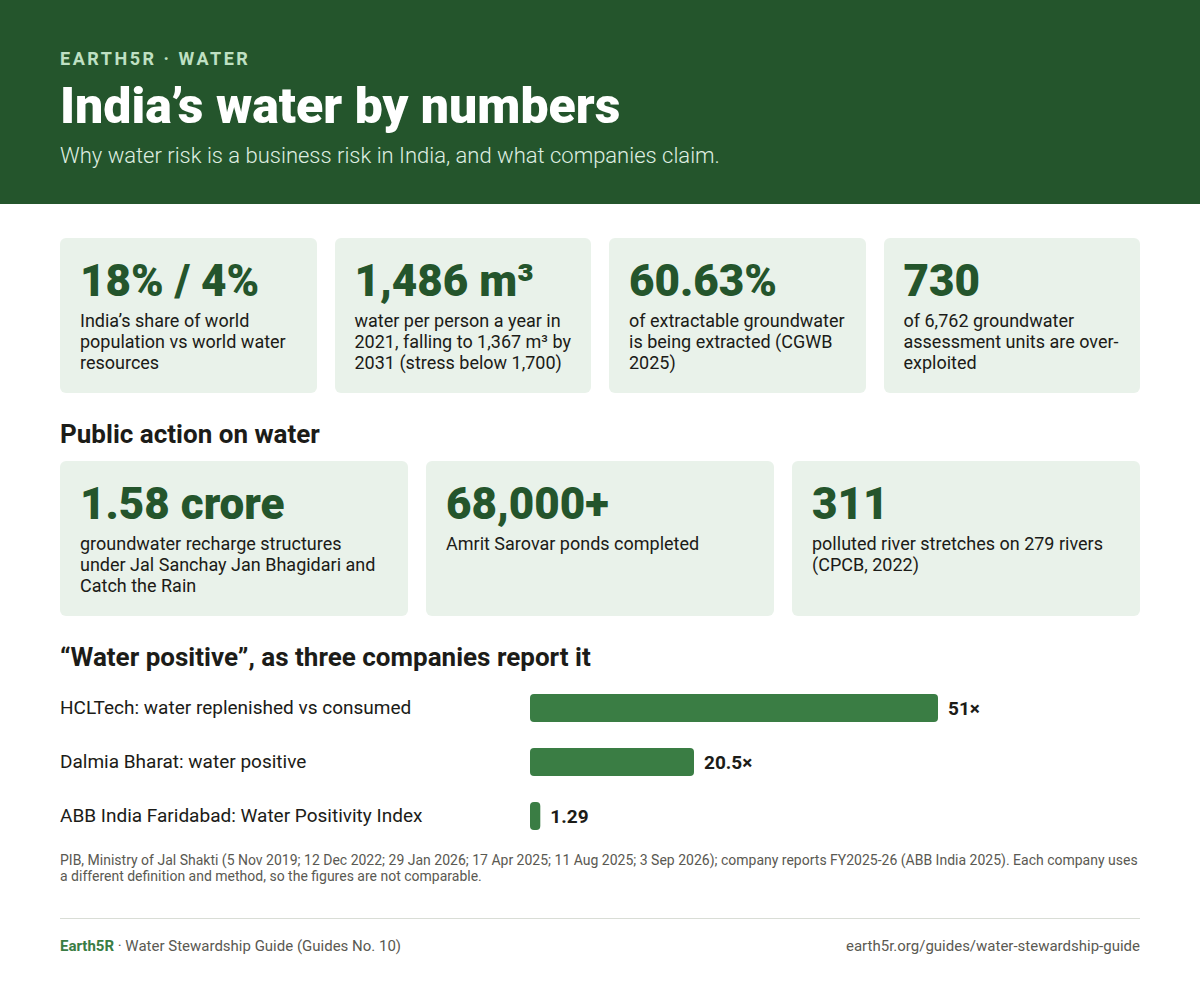
The country hosting this growth has 18% of the world’s population and 4% of its water resources.[1] Water availability per person was 1,486 cubic metres in 2021, below the 1,700 m³ line commonly used to mark water stress.[5] The Central Ground Water Board’s 2025 assessment found 60.63% of extractable groundwater already being extracted, with 730 of 6,762 assessment units over-exploited.[4]
Where a data centre’s water goes
Servers turn almost all the electricity they use into heat, which must be removed continuously. How that heat is rejected decides how much water a facility uses. Two channels matter most.
Direct use, on site
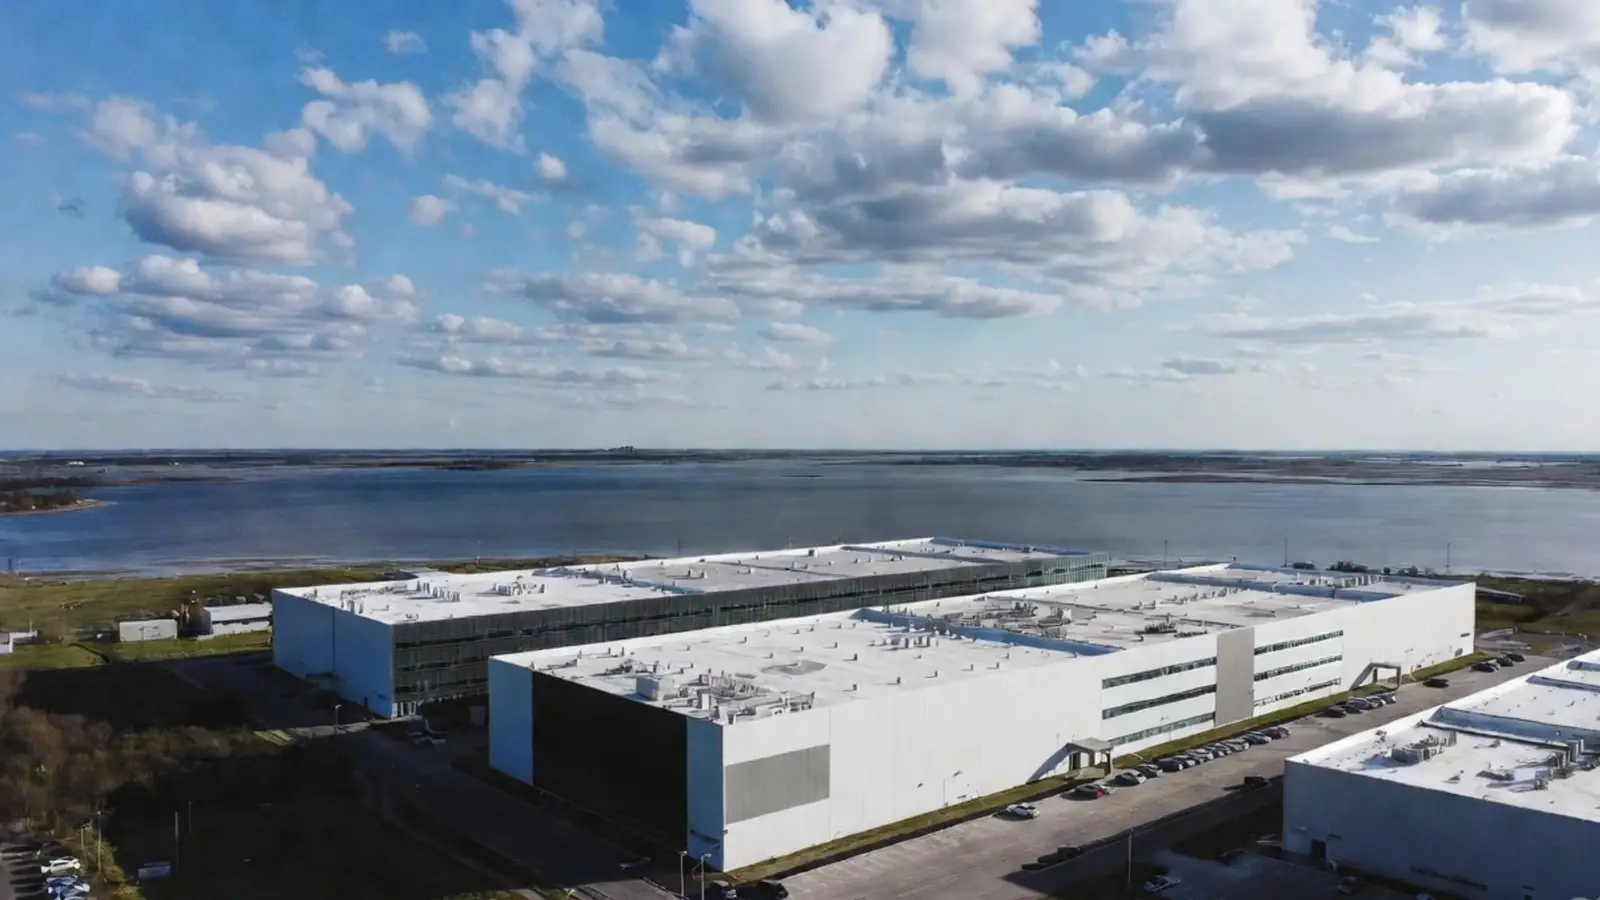
Facilities that reject heat through cooling towers or evaporative systems lose water to evaporation and to blowdown. IEA estimates quoted by CEEW put a 100 MW hyperscale facility at roughly 0.8 to 2 million litres a day for on-site cooling, depending on design and climate.[1][2] At the CPHEEO urban norm of 135 litres per person per day,[12] that is the daily domestic supply of roughly 6,000 to 15,000 people.
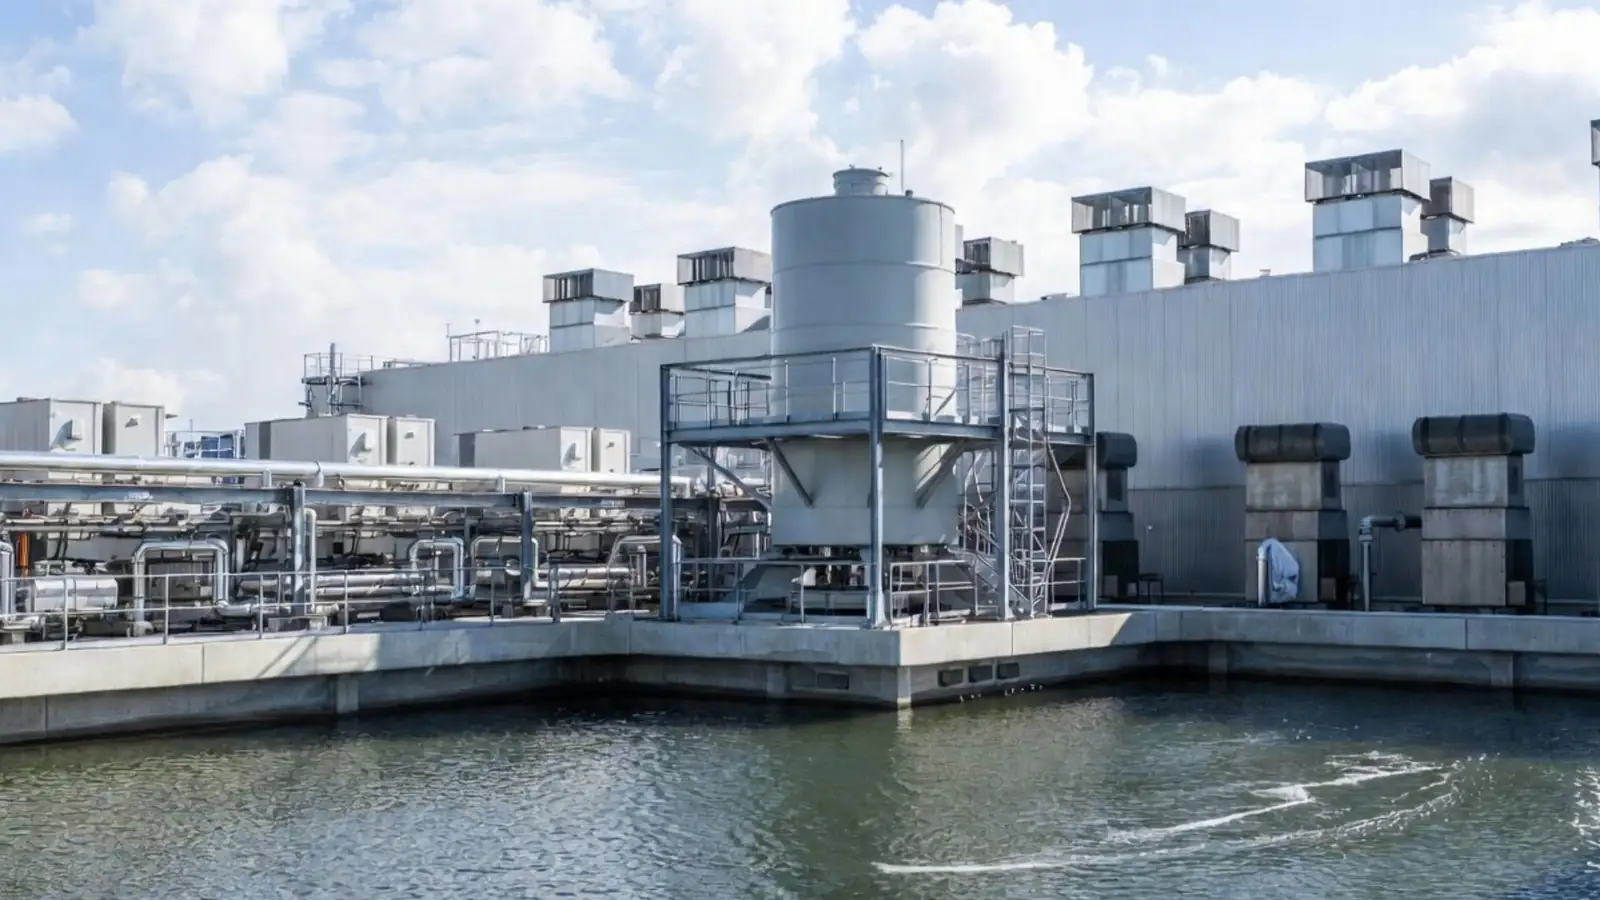
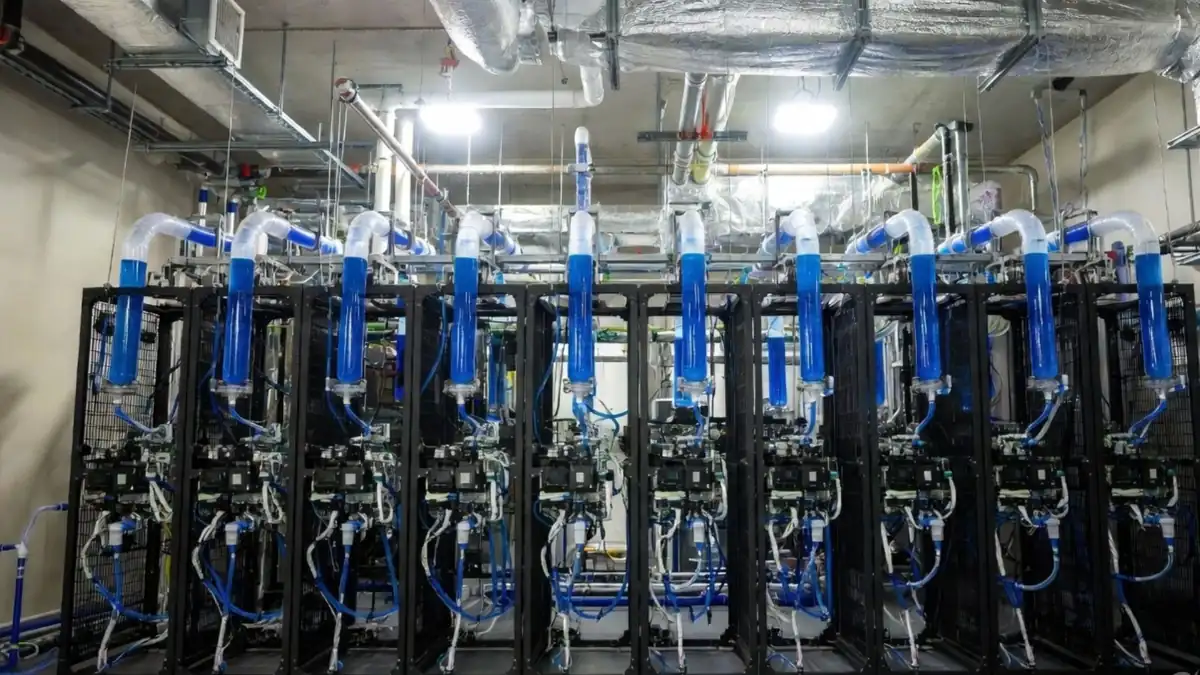
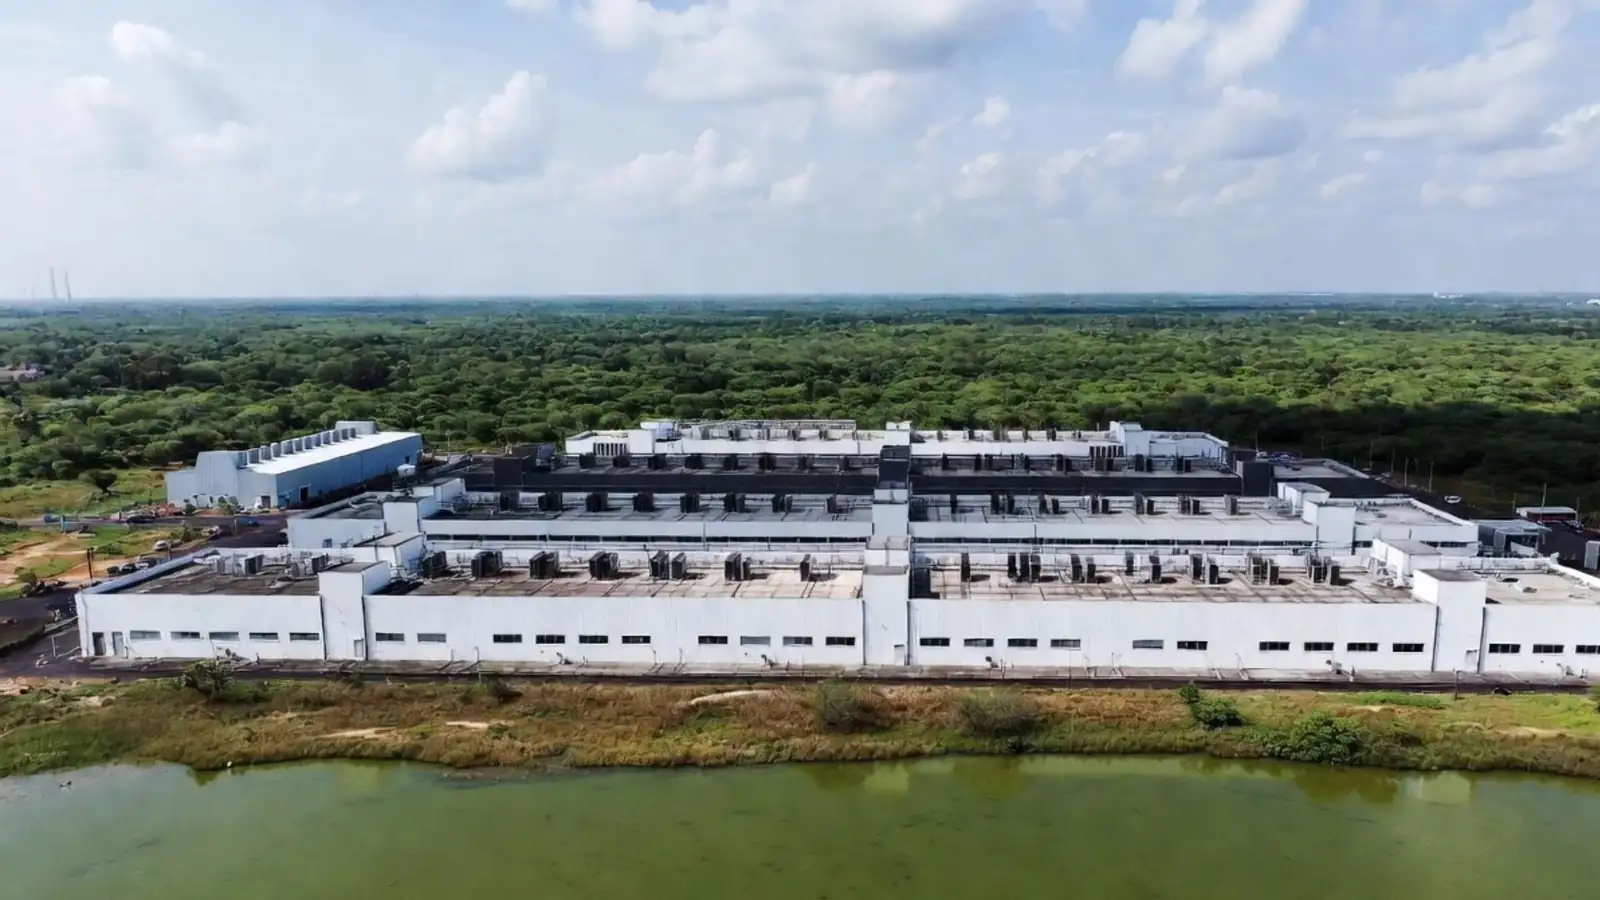
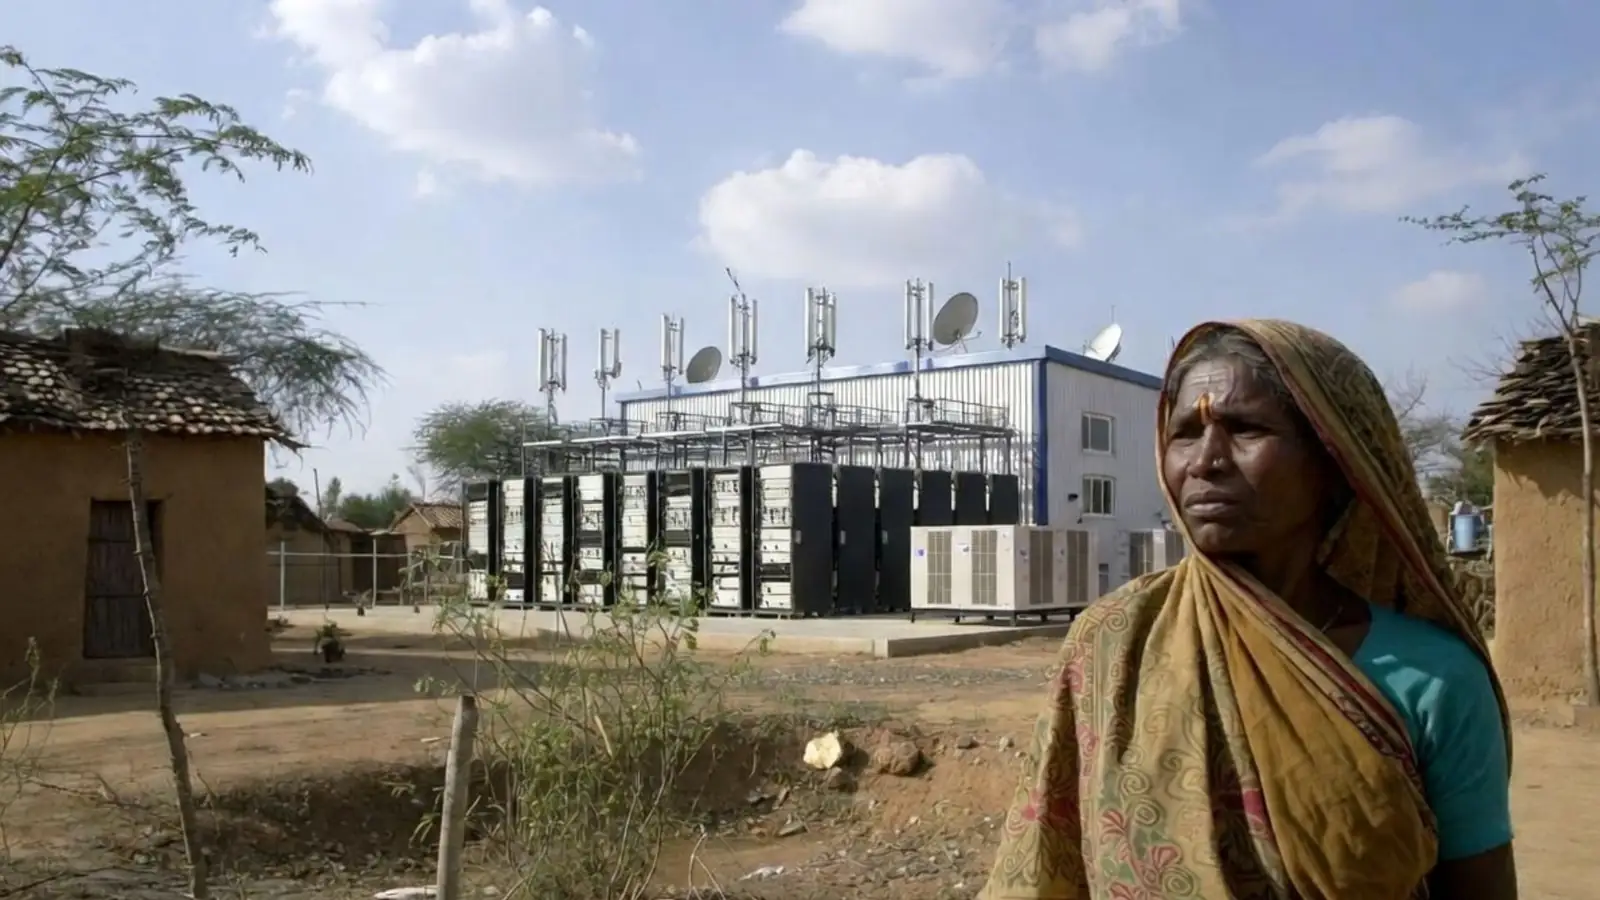
Three details shape the number. Rack densities have risen from about 1–3 kW in the early 2000s to around 8 kW today, which raises cooling intensity.[1] Smaller facilities, under about 5 MW, rely mainly on municipal water for cooling.[1] Liquid cooling inside servers is usually a closed loop that uses little water, but the cooling towers that reject that heat to the air can still use a great deal.[2] Some coastal hyperscale sites in Mumbai and Chennai use seawater cooling.[1]
Indirect use, through electricity
Much of India’s electricity still comes from thermal power plants, which need water for their own cooling. A facility that cuts on-site water by moving to air cooling will usually draw more power, and part of its water footprint moves to the catchment of the power plant.[1][2] Any honest water account for a data centre therefore needs both channels, and the trade-off between them should be stated rather than hidden.
Six challenges
1. Clustering in stressed cities
About a quarter of facilities are in Mumbai, followed by Chennai, Hyderabad and Bengaluru.[1] CEEW finds 57% of Indian districts at high to very high risk of extreme heat, including many data centre hubs, so cooling demand peaks in summer when water is scarcest.[2]
2. Competing with households
Facilities drawing on groundwater or municipal supply may compete directly with households and agriculture.[2] In cities where many homes already receive water intermittently, a new large user in the same network matters.
3. No reporting, no benchmark
There are no sector-wide water or energy performance standards and no mandatory reporting of water use, electricity or emissions. Energy-efficiency guidance for data centres was last issued in 2010, and data centres are not Designated Consumers under energy law.[2]
4. Incentives ahead of safeguards
Fifteen states support data centres through dedicated or general policies, but only five include explicit sustainability provisions. Rajasthan’s 2025 policy is the most complete, requiring wastewater recycling, zero liquid discharge, rainwater harvesting and groundwater recharge.[1]
5. Risk perception behind risk
Most industry stakeholders consulted by CEEW rated water risk low to medium. The authors note this may reflect the sector’s early stage and understate future constraints.[1]
6. The power–water trade-off
Lower water use can mean higher power use, and the reverse. Without both numbers reported side by side, an improvement in one metric can hide a loss in the other.[1]
What this means for BRSR and sustainability reporting
SEBI requires India’s top 1,000 listed companies by market capitalisation to publish a Business Responsibility and Sustainability Report.[7] Principle 6 asks for water withdrawal by source, consumption, water intensity, discharge by destination and level of treatment, and whether the company has zero liquid discharge. A leadership indicator asks for the same figures for operations in water-stressed areas. Under BRSR Core, the water footprint is one of the attributes subject to assessment or assurance, and SEBI has set out a framework for ESG disclosures across the value chain.[6]
The table maps those disclosures to the ways data centre water can appear in a company’s reporting.
| BRSR disclosure | What it asks | Where data centre water appears |
|---|---|---|
| P6: withdrawal by source | Surface water, groundwater, third-party water, seawater or desalinated water, other | Operators and companies with their own server facilities report it directly. Cloud users do not, though their providers draw it. |
| P6: consumption and intensity | Total water consumed and consumption per rupee of turnover | A material line for operators. For buyers, a value-chain figure to request. |
| P6: discharge and treatment | Discharge by destination and treatment level; zero liquid discharge | Cooling tower blowdown and how it is treated or reused |
| P6 leadership: water-stressed areas | Withdrawal, consumption and discharge in stressed areas | Facilities in over-exploited or critical groundwater blocks and stressed basins |
| BRSR Core: water footprint | Consumption, intensity and discharge, with assessment or assurance | Listed operators; quality of metering and records |
| Value-chain disclosures | ESG disclosures for significant value-chain partners | Cloud, colocation and AI providers serving banks, IT services, e-commerce and others |
Who needs to act
- Data centre operators, who carry the water in their own BRSR and environmental clearances.
- Companies running their own server rooms or captive data centres, whose cooling water is already inside their Principle 6 numbers, often unmetered.
- Companies buying cloud, colocation and AI services, for whom it is a value-chain question, much like Scope 3 emissions.
- Banks and investors financing the build-out, who carry the water risk of the assets they fund.
Six questions for boards and sustainability committees
- Which data centres host our critical workloads, and in which river basins and groundwater blocks are they located?
- Do our providers report water withdrawal, consumption and WUE for those sites?
- Which source do those sites draw from: municipal supply, groundwater, tankers, recycled water or seawater?
- Are any of them in over-exploited or critical groundwater blocks?
- Does our replenishment or CSR water work take place in the same basins?
- How will we report this in our BRSR and sustainability report, and what method will we state?
A method for water stewardship around data centres
The eight steps below follow the order in which the work has to be done. They draw on the five-step structure of the Alliance for Water Stewardship Standard,[9] the Volumetric Water Benefit Accounting method (VWBA 2.0),[8] and Earth5R’s field experience.[13] They apply equally to an operator, a company with server rooms and a company that buys cloud services, with the scope adjusted.
- Map the footprintList your own sites and your data centre providers. For each, record water source, withdrawal, consumption and discharge, and ask providers for WUE.
- Build a site water balance in BRSR formatMeter every source and every major use. Reconcile what comes in with what is consumed and discharged.
- Screen the catchmentCheck the groundwater category of each block, basin water stress, and exposure to heat and flooding.
- Reduce and reuse firstImprove cooling efficiency, use treated wastewater or recycled water for cooling, and aim for zero liquid discharge only where it is real. Sending wastewater to a municipal plant is treated discharge, not zero discharge.
- Replenish in the same basinFund water projects in the catchment where the water is withdrawn. Benefits in another basin do not offset local stress.
- Work with the people who share the catchmentHousing societies, households, farmers and local bodies decide most of the water use around a site. Plan with them, not for them.
- Measure with a stated methodSet a baseline, monitor over time and count water actually delivered, not the design capacity of systems installed. VWBA 2.0 is one widely used method.
- Verify and discloseSeek assessment or assurance, report in BRSR Principle 6 and CDP Water Security, and state the method and its limits alongside the numbers.
Earth5R’s approach: a worked example of steps 5 to 8
Earth5R has worked on urban and rural water with households, housing societies and villages since 2015. These programmes were not designed around data centres. They are included because they test the part of the method that is hardest to do well: working with the community that shares a catchment, and measuring what results. They are set out here, with their limits, so that others can compare, question and improve on them.
How the work is done
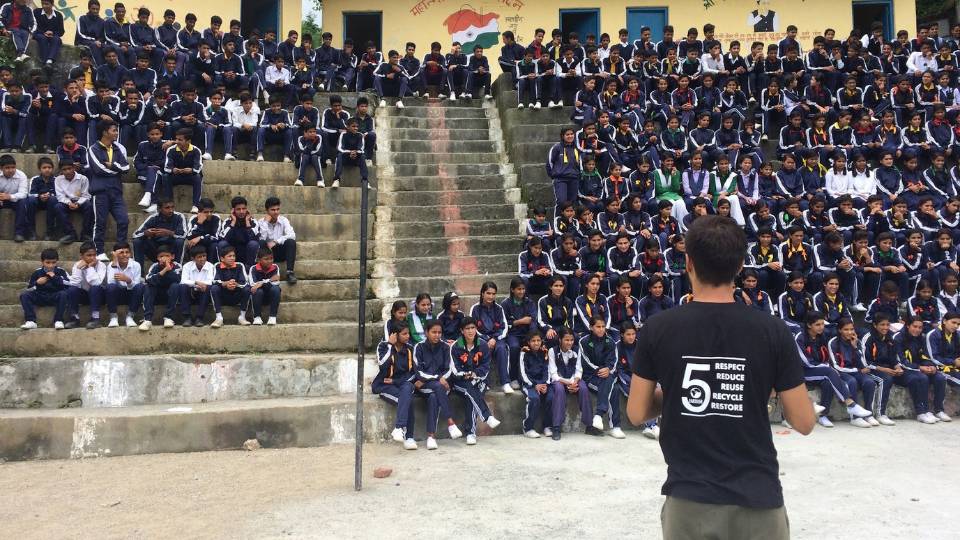
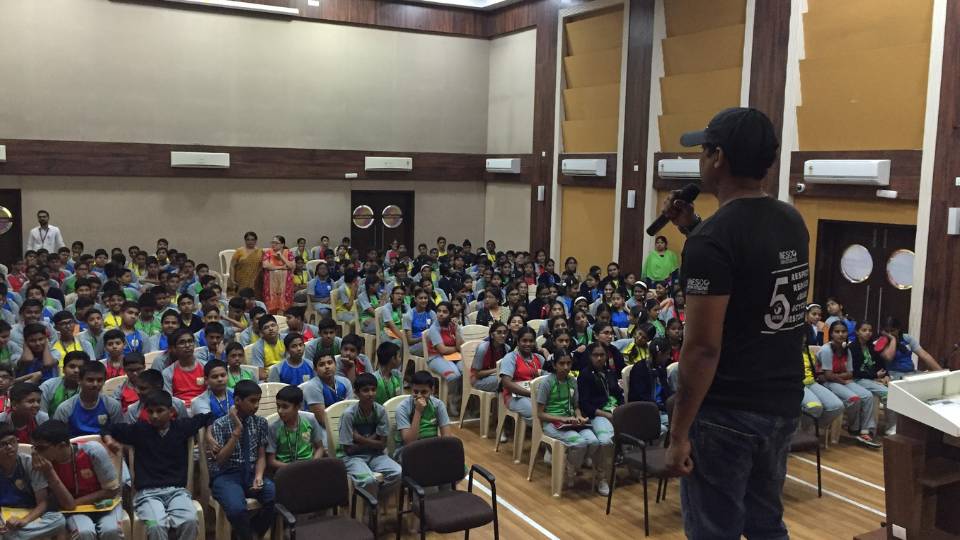
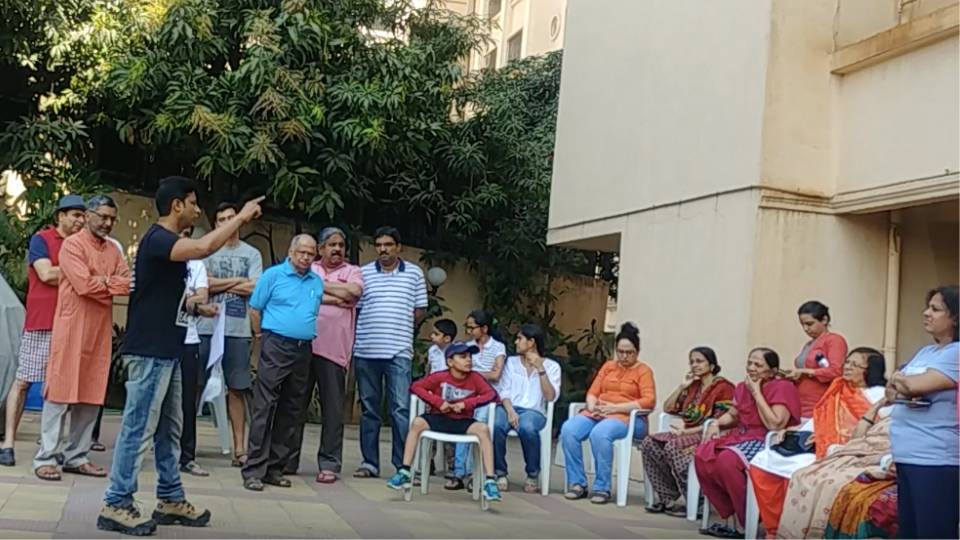
- Start with the group that decides. In Indian cities, rainwater harvesting, recycling and plumbing changes are decided by a housing society, not by one flat. Volunteers facilitate society meetings rather than relying on individual persuasion.[14]
- Combine measures. Buildings are helped to adopt more than one measure: rainwater harvesting, greywater or wastewater reuse, and water-efficient fixtures.[14]
- Make the result visible. Water bills and meter readings are shared in common areas or resident groups, so residents see the change.[14]
- Concentrate in one catchment. Effort is focused on one neighbourhood until adoption spreads by example, rather than spread thinly across a city.[14]
- Train local people to maintain systems and keep records. Installations are logged with location and photographs, with follow-up visits at three and twelve months.[14][15]
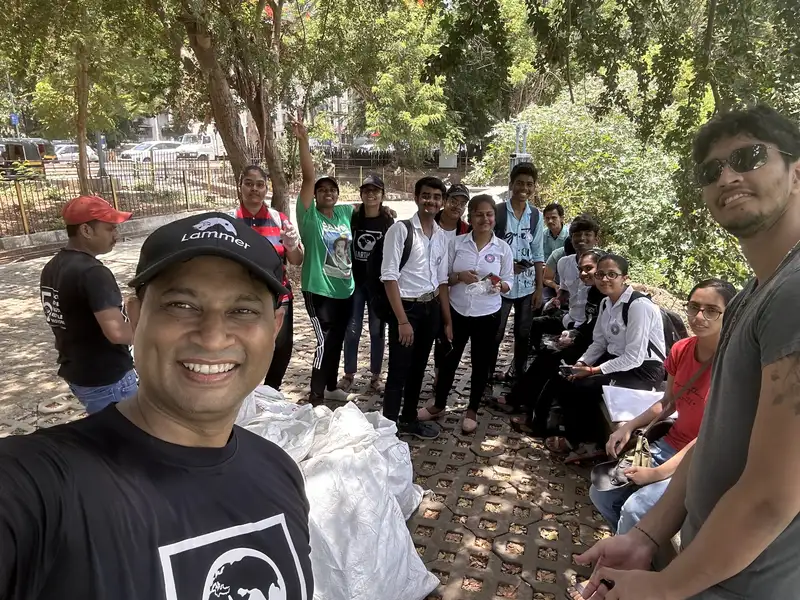
- Plan for handover. On the Mithi River in Mumbai, the recovery system and catchment programme were designed to continue under local delivery partners after Earth5R stepped back.[16]
What the programmes report
All figures below are programme-reported. They come from different programmes with different methods and periods, and should not be added together.
| Programme | Period | Scale | Reported result | How it was measured |
|---|---|---|---|---|
| Urban water conservation with housing societies[14] | 2015–2025 | 490,000+ buildings reached; 34,300+ adopted at least one measure (about 7%) | 16.9 billion litres saved, cumulative | Bills compared before and after for about 35% of adopting buildings; savings factors by technology for the rest |
| Water stewardship with a beverage brand partner, Pure Norway[15] | 2015–2025 | 8,400+ rainwater harvesting systems, urban and rural; 2,100+ wastewater installations | 11.6 billion litres a year of harvesting and recycling capacity, 2025 | Installation records and quarterly flow-meter readings |
| Community finance and livelihood training[17] | 2022–2025 | 60 districts in 15 states and union territories; 321,274 people trained | 158 million litres of additional household water storage | Programme monitoring records |
| Mithi River, Mumbai[16] | Oct 2020–Nov 2024 | Solar-powered recovery unit; 10,000 families and 500 businesses trained in the catchment | 11,100 tonnes of waste removed from the river | Weighed recovery and drone mapping |
Additional household water storage created each year
Community finance and livelihood training programme, million litres per year, 60 districts
Source: Earth5R programme monitoring data, 2022–2025.[17] Storage capacity created, not water saved.
What the programme data suggests
The urban programme’s records point to four patterns. They are observations from one organisation’s data, not tested findings, and are offered as hypotheses for others to examine.[14]
- Decisions taken at housing society meetings were followed by adoption about four times more often than individual conversations.
- Buildings that adopted two or more measures saved about 2.3 times as much water as single-measure buildings.
- Buildings with visible feedback, such as posted bills or meter readings, kept their practices at a rate about 31% higher after two years.
- Once roughly 12–15% of buildings in a neighbourhood had adopted, further adoption continued with little outside effort. This was observed in 14 programme cities.
Limits of this data
- The figures are programme-reported and have not been independently audited for this article.
- In the urban programme, savings for about 65% of adopting buildings are estimated from technology-specific factors rather than measured.[14]
- Harvesting capacity and storage created are not the same as water delivered. Methods such as VWBA 2.0 exclude design capacity from benefit claims.[8]
- Buildings that chose to adopt may already have been more motivated, so the comparisons above may overstate the effect of the method.
- The programmes overlap with data centre cities such as Mumbai, Chennai, Hyderabad and Bengaluru, but have not been mapped against data centre catchments at basin level.

How the approaches compare
Regulation reduces the footprint at its source. Community stewardship works on what remains in the catchment. Neither replaces the other, and the table shows where each one acts.
| Approach | Who acts | What it does for water |
|---|---|---|
| Rajasthan data centre policy, 2025 | State government and operators | Requires wastewater recycling, zero liquid discharge, rainwater harvesting, groundwater recharge and green building standards[1] |
| EU Energy Efficiency Directive, 2023 | Operators above 500 kW | Mandatory reporting of energy and water; waste heat recovery above 1 MW[1] |
| China Green Data Centre Standards | Operators | Caps on the ratio of cooling water to energy[1] |
| Singapore Green Data Centre Roadmap | Government and operators | A pause on new capacity, then approval only for highly efficient facilities in designated zones[2] |
| Community catchment method (Section 6) | Housing societies, households, villages, with company funding | Measured reuse, harvesting and recharge in the same catchment; depends on measurement quality and funding continuity |
CEEW recommends that India mandate water reporting and then set water-efficiency standards for large data centres, especially in water-stressed regions, and build land, energy and water risk assessments into siting decisions.[2] Companies do not need to wait for that rule to measure, disclose and act.
Open questions for research
- What is the actual water use of Indian facilities? There is no public facility-level dataset of WUE by climate zone and cooling type.
- How much water do data centres use indirectly through electricity in each grid region, and how does that change with the renewable share?
- Where do data centre catchments overlap with over-exploited groundwater blocks and with neighbourhoods that already receive intermittent supply?
- Who bears the cost locally? Water scarcity in India falls unevenly, and in many households the work of securing water falls on women and girls. How data centre siting changes that burden has not been studied.
- Which replenishment methods deliver verifiable volumes in dense Indian cities, and at what cost per kilolitre?
- Can community monitoring (resident meter readings, bills and photographs) meet the evidence standard needed for BRSR Core assessment or assurance?
Earth5R is open to sharing programme data with researchers working on these questions, under suitable data agreements.
For companies that want to act on this
Earth5R works with CSR, sustainability and ESG teams on the following. Water projects qualify for CSR spending under Schedule VII of the Companies Act, which covers environmental sustainability, conservation of natural resources and the quality of water.[10]
- CSR water projects in the basins where your sites or your providers draw water: rainwater harvesting, reuse, recharge and housing society programmes, with measurement planned from the start.
- BRSR and ESG water data: site water balances, value-chain questions for providers and disclosure support. See ESG and BRSR reporting services.
- Employee volunteering on rivers, lakes and water conservation. See the Employee Volunteering Guide.
- Recycling of retired IT hardware and packaging through e-waste collection under the E-Waste (Management) Rules, 2022,[11] and plastic recovery under EPR. See the e-waste collection programme and the Plastic Waste and EPR Guide.
- AI and water roundtables for boards, campuses and housing societies near data centres. See AI Risks and Sustainability.
Frequently asked questions
- How much water do data centres in India use?
- About 150 billion litres in 2024, a figure expected to more than double by 2030.[1]
- Why do data centres need water?
- Servers turn electricity into heat. Many facilities remove that heat with cooling towers or evaporative systems, which lose water to evaporation. Air-cooled designs use less water but more electricity.[1]
- Which Indian cities have the most data centres?
- Mumbai has about a quarter of India’s data centres, followed by Chennai, Hyderabad and Bengaluru.[1]
- Do data centres in India have to report their water use?
- There is no sector-wide requirement or water-efficiency standard.[2] Listed operators report water under BRSR Principle 6 like any other listed company.[7]
- Does my company’s BRSR cover the water used by our cloud provider?
- Not in your own Principle 6 figures. It is a value-chain issue, and SEBI’s BRSR Core framework sets out ESG disclosures for the value chain.[6] Asking providers for site-level water data is a sensible first step.
- What is Water Usage Effectiveness (WUE)?
- A metric for data centres: litres of water used on site for each kilowatt-hour of energy used by IT equipment. Lower is better, but it should be read together with power use.
- Can CSR funds be used for water projects?
- Yes. Schedule VII of the Companies Act covers environmental sustainability, conservation of natural resources and maintaining the quality of water.[10]
References
- Tripathi, V., Bagui, D., Aggarwal, P., Hulshof, P., Chopra, A., Jain, D. and Vashishtha, A. (2026). Scaling India’s Data Centre Ecosystem: Stakeholder Perspectives on Infrastructure, Energy, and Resilience. Council on Energy, Environment and Water and SYSTEMIQ. ceew.in
- Malik, A. and Elango, S. (2026). Why India must plan for AI data centres’ energy and water footprint. CEEW, 19 January 2026. ceew.in
- International Energy Agency (2025). Energy and AI. iea.org
- Press Information Bureau (2026). Dynamic Ground Water Resources Assessment 2025, Central Ground Water Board. 29 January 2026. pib.gov.in
- Press Information Bureau (2022). Per capita water availability. 12 December 2022. pib.gov.in
- Securities and Exchange Board of India (2023). BRSR Core: Framework for assurance and ESG disclosures for value chain. Circular dated 12 July 2023. sebi.gov.in
- Securities and Exchange Board of India (2021). Business Responsibility and Sustainability Reporting by listed entities. Circular dated 10 May 2021. sebi.gov.in
- World Resources Institute and partners (2025). Volumetric Water Benefit Accounting (VWBA) 2.0.
- Alliance for Water Stewardship (2026). AWS Standard, Version 3.0. a4ws.org
- Government of India. Companies Act, 2013, Schedule VII.
- Ministry of Environment, Forest and Climate Change (2022). E-Waste (Management) Rules, 2022.
- Central Public Health and Environmental Engineering Organisation. Manual on Water Supply and Treatment. Ministry of Housing and Urban Affairs.
- Gupta, S. (2026). Water Stewardship Guide. Earth5R Guides No. 10. earth5r.org
- Earth5R (2026). Water Conservation in Urban India: Programme Evidence, 2015–2025. Report WC-2025-003. earth5r.org
- Earth5R (2026). Plastic Recovery and Water Stewardship in the Beverages Industry, 2015–2025. Report BEV-2025-004. earth5r.org
- Gupta, S. (2026). Mithi River Plastic Waste Cleanup: Case Study. Earth5R. earth5r.org
- Earth5R. Community finance and livelihood training programme: monitoring dataset, 2022–2025. Unpublished programme data.
How to cite this article
Gupta, S. (2026). Data Centres and Water in India: Risks, Disclosure and a Community Method for Catchment Stewardship. EarthJournal, Earth5R, 7 October 2026. https://earth5r.org/data-centres-water-india/
Figures for data centres are taken from the sources cited and were current as of October 2026. Earth5R programme figures are programme-reported and are described with their methods and limits in Section 6. This article is for information and is not legal advice.