
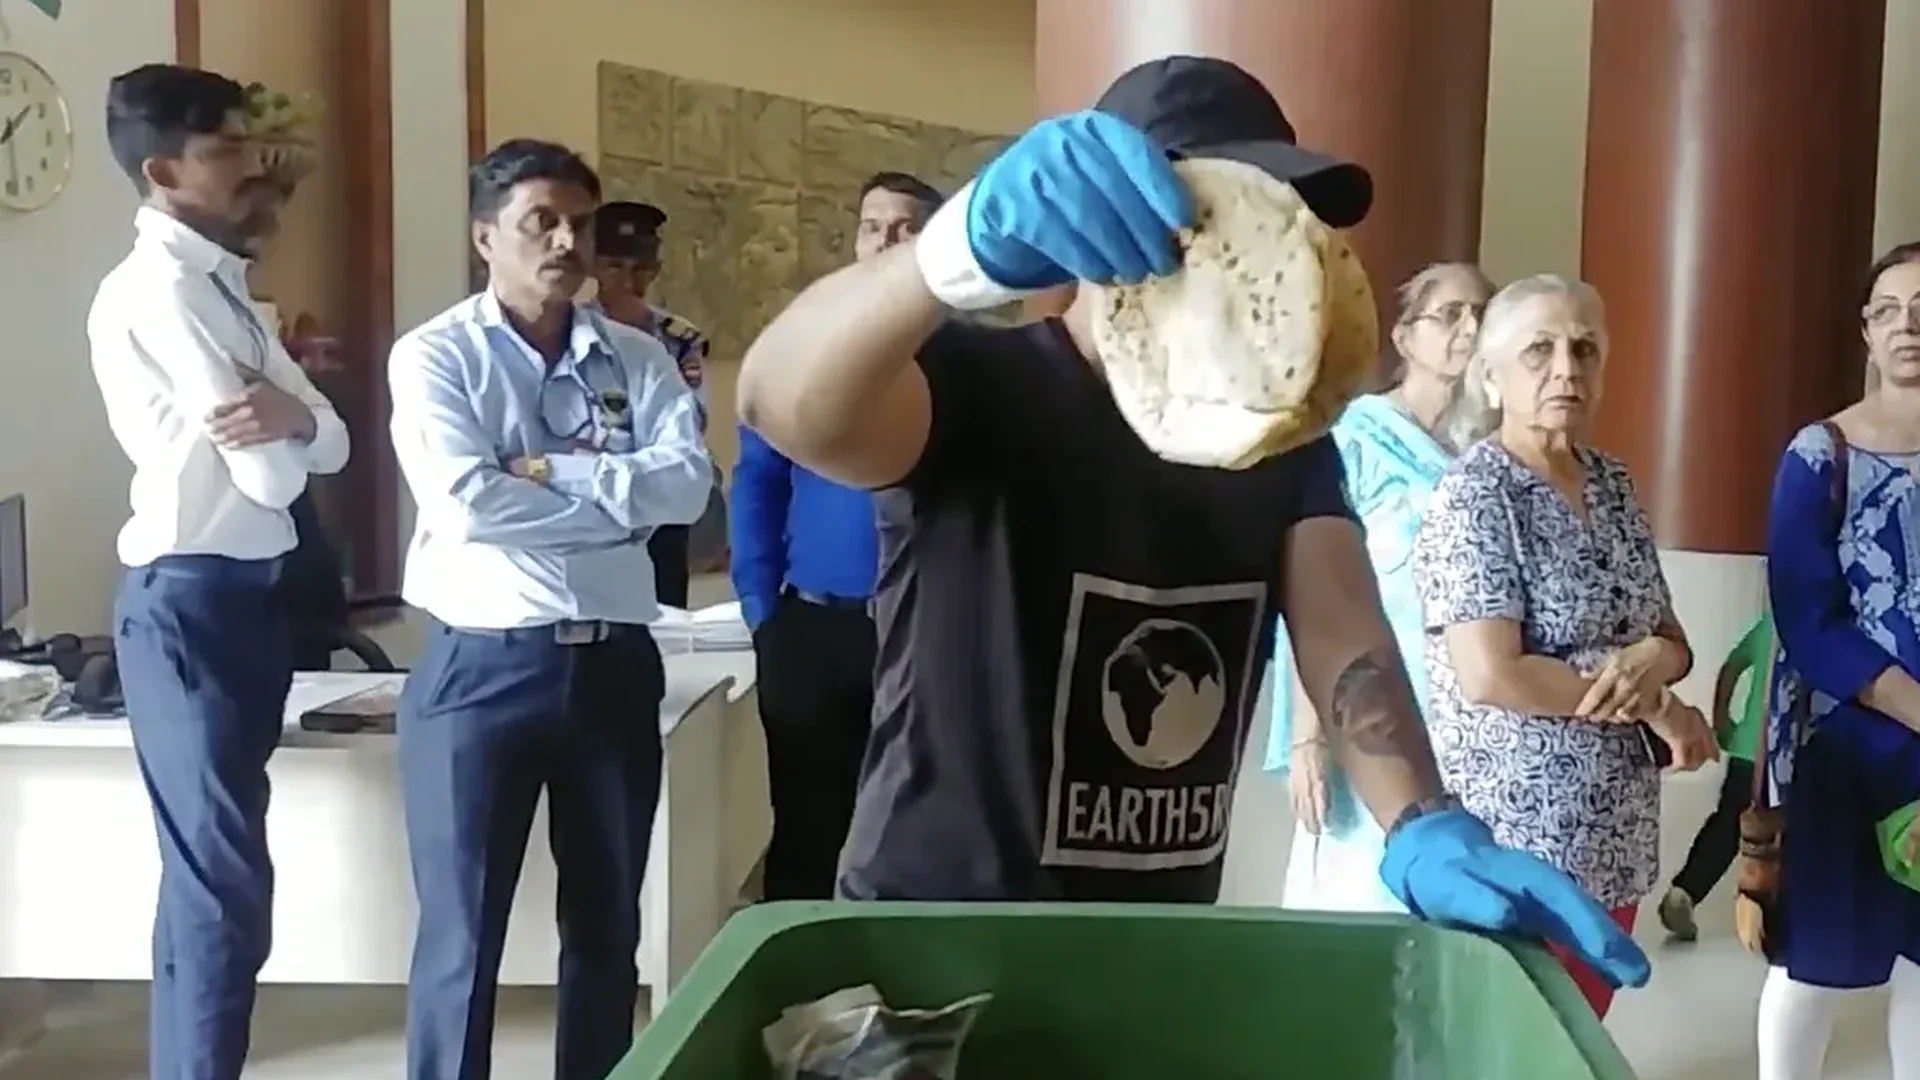
A day after World Food Day, the numbers on food waste in India still sit awkwardly beside the numbers on hunger. These ten facts, drawn from UN, government and research sources, show how much food is lost on farms and wasted in kitchens, where it ends up, what it does to the climate, and what the Solid Waste Management Rules, 2026 now require of the people who throw it away.
Food waste in India: the ten facts at a glance
- Indian homes throw away about 78 million tonnes a year
- Add restaurants and shops and it nears 138 million
- The waste sits beside a serious hunger problem
- ₹1.53 lakh crore is lost before food reaches a kitchen
- Half of what cities collect is organic
- Biogas handles under 1% of the waste
- Rotting food is a methane problem
- Since April 2026, wet waste must stay out of landfills
- BRSR has no line for food waste
- Countries that measured first cut waste fastest
For the regulation behind facts 8 and 9, read our analysis of the SWM Rules 2026 and India’s four-stream waste segregation shift.
01
Indian homes throw away about 78 million tonnes of food a year
The UN Environment Programme’s Food Waste Index Report 2024 puts household food waste in India at 55 kilograms per person per year, or 78.2 million tonnes for the country in 2022.[1] The world household average is 79 kilograms per person,[2] and households worldwide wasted more than a billion meals a day in 2022.[6] The figure counts both edible food and inedible parts such as peels, shells and bones, because both end up in the same bin.
India’s per-person figure is below the world average. Globally, rural areas tend to waste less, with scraps going to livestock and home compost,[6] yet India’s one rural estimate is slightly above its urban average.[7] And India’s number rests on a handful of local studies rather than a national survey. The UN rates it “medium confidence” and names India among the countries that need representative national food waste studies.[7] The local studies behind it range from 20 to 88 kilograms per person.
Household food waste in Indian studies, kg per person per year
Studies used by UNEP for India’s estimate. Dashed lines mark India’s national estimate (55) and the world household average (79).
Source: UNEP Food Waste Index Report 2024, as summarised by Down To Earth.[7][6] Study years vary; the Rishikesh, Mangalore and Thiruvananthapuram study years are not listed in the summary.
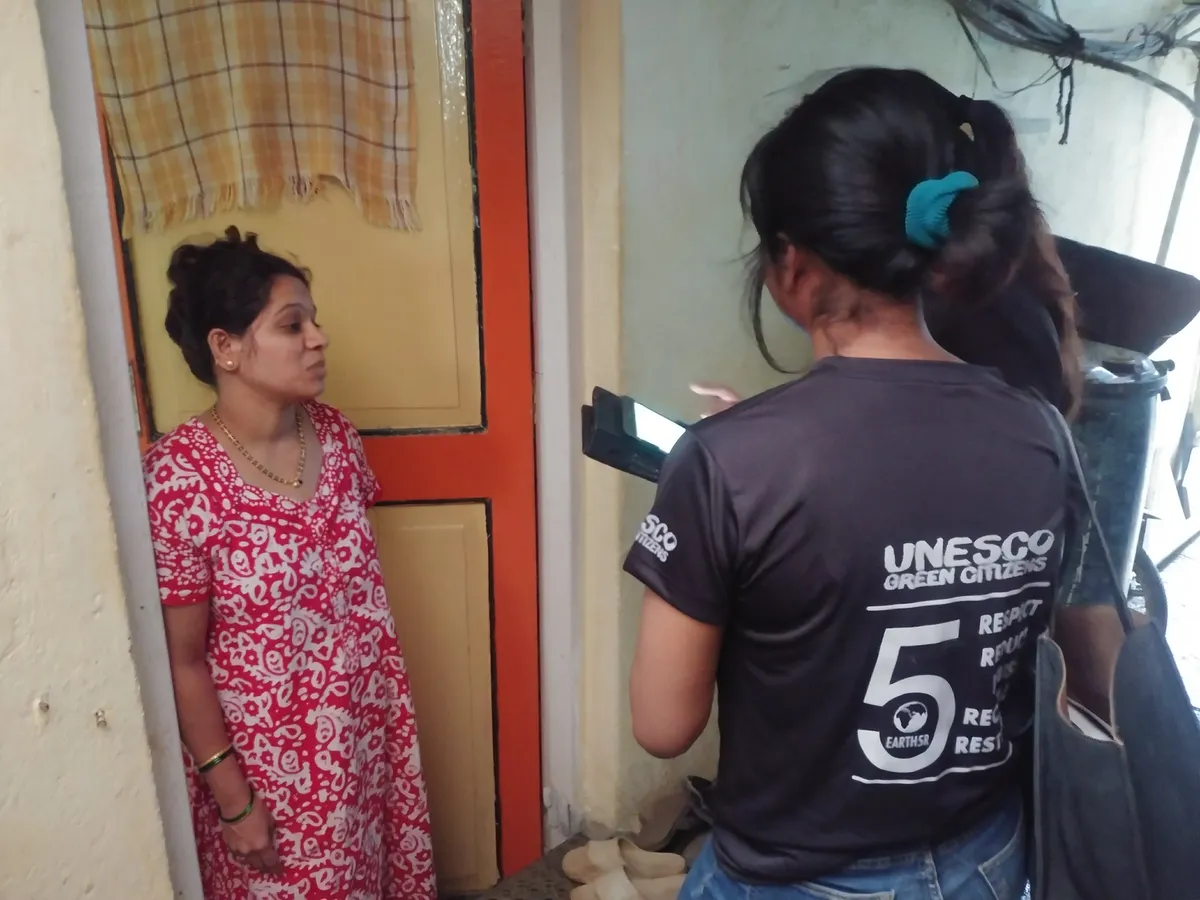
A national estimate built on seven city studies cannot show whether India is improving. Housing societies, campuses and companies that weigh their own wet waste produce better data than the national figure, and they are the ones who can act on it.
02
Add restaurants and shops, and the estimate nears 138 million tonnes
Households are only part of the picture. Worldwide, 60% of food waste happens in homes, 28% in food service such as restaurants, canteens and caterers, and 12% in retail.[6] The report’s appendix gives India a food service estimate of 32 kilograms per person (46.0 million tonnes) and a retail estimate of 10 kilograms per person (13.7 million tonnes).[1] Added to households, that comes to about 138 million tonnes a year.
Treat that total with care. Both the food service and retail figures are rated “very low confidence”, which means they are extrapolated from averages for other countries, mostly high-income ones, rather than measured in India.[1] Only four G20 countries and the European Union have food waste estimates good enough to track progress to 2030.[6]
Food waste in India by sector, 2022, million tonnes
UNEP estimates with the report’s own confidence rating
Source: UNEP Food Waste Index Report 2024, Appendix, sections 3.1–3.3.[1] Household 78,192,338 t; food service 46,037,319 t; retail 13,715,198 t.
Hotels, caterers, hospitals and office canteens hold the least-measured share of India’s food waste. Most of them cross the bulk waste generator threshold under the new rules (fact 8), so the first weighed numbers are likely to come from them.
03
The waste sits beside a hunger score the index calls serious
The Global Hunger Index 2026 ranks India 100th of the 122 countries with enough data, with a score of 24.1, in the “serious” band. That is a real improvement from 38.1 in 2000 and 25.8 in 2018, but India still shares its rank with Ethiopia.[5] Worldwide, 783 million people were affected by hunger in 2022, the same year households threw away more than a billion meals a day.[6]
Redistribution of surplus food helps, but it is small next to the waste. India’s food regulator runs a “Save Food Share Food” initiative and an Indian Food Sharing Alliance of surplus food agencies. In March 2025 the alliance had 82 registered agencies reaching more than 90 cities.[2]
Most food waste is not surplus that could have fed someone. It is leftovers, spoiled produce and peels, which is why prevention and processing matter more than donation.
Hunger and food waste are linked by poverty, prices and logistics, not by a simple transfer from one plate to another. Companies that fund food recovery should pair it with prevention and processing, or the bigger share of the problem stays untouched.
04
₹1.53 lakh crore of food is lost before it reaches a kitchen
“Waste” happens in kitchens and shops. “Loss” happens earlier, between the field and the market. A 2022 study for the Ministry of Food Processing Industries by NABARD Consultancy Services (NABCONS) estimated harvest and post-harvest losses of major farm produce.[8] It valued the losses at about ₹1.53 trillion (US$18.5 billion) a year, or ₹1.53 lakh crore.[3]
By weight, the biggest losses are in plantation crops, cereals and vegetables. By percentage, fruit and vegetables are the most fragile, losing up to 15% and 12%.[8] Fruits and vegetables together account for around ₹57,000 crore of the losses, cereals for about ₹26,000 crore, and perishables lose 5–10% in transport alone.[9] Globally, 13.3% of food was lost after harvest and before retail in 2023, slightly up from 13.0% in 2015.[10]
Harvest and post-harvest losses in India, million tonnes a year
Quantity lost, with the range of losses as a share of production
Source: NABCONS study for MoFPI, quantities for 2020–21, as reported to the Rajya Sabha, February 2025.[8]
Earth5R’s work with farmers on this end of the chain is described in bringing affordable harvesting tools to rural farmers.
Loss and waste need different fixes. Cold chains, storage and better harvesting tools cut loss on farms; measurement, menus and segregation cut waste in cities. A CSR or ESG programme should say which one it is targeting.
05
Half of what Indian cities collect is organic
NITI Aayog estimates that India generated about 101 million tonnes of solid waste in 2020. About half of municipal solid waste was organic or compostable, a quarter recyclable, 15% combustible but not recyclable, and 10% other material.[4] Most of the organic share is food: kitchen scraps, vegetable and fruit waste, and leftovers.
Cities report steady progress in processing. Under Swachh Bharat Mission–Urban, states reported 1,62,468 tonnes of municipal solid waste a day in December 2025, of which 1,30,484 tonnes, or 80.31%, was processed, against 16% in 2014. There are now 7,783 processing facilities.[11] The two sources measure different things: NITI Aayog found that 61% of India’s solid waste was still landfilled in 2020 (fact 6), while the mission figure is processing capacity reported by states for 2025. Both point the same way. Food waste is the largest single stream to manage.
What India’s municipal solid waste is made of
Share by weight, 2020
Source: NITI Aayog (2026), citing the Centre for Science and Environment (2022).[4]
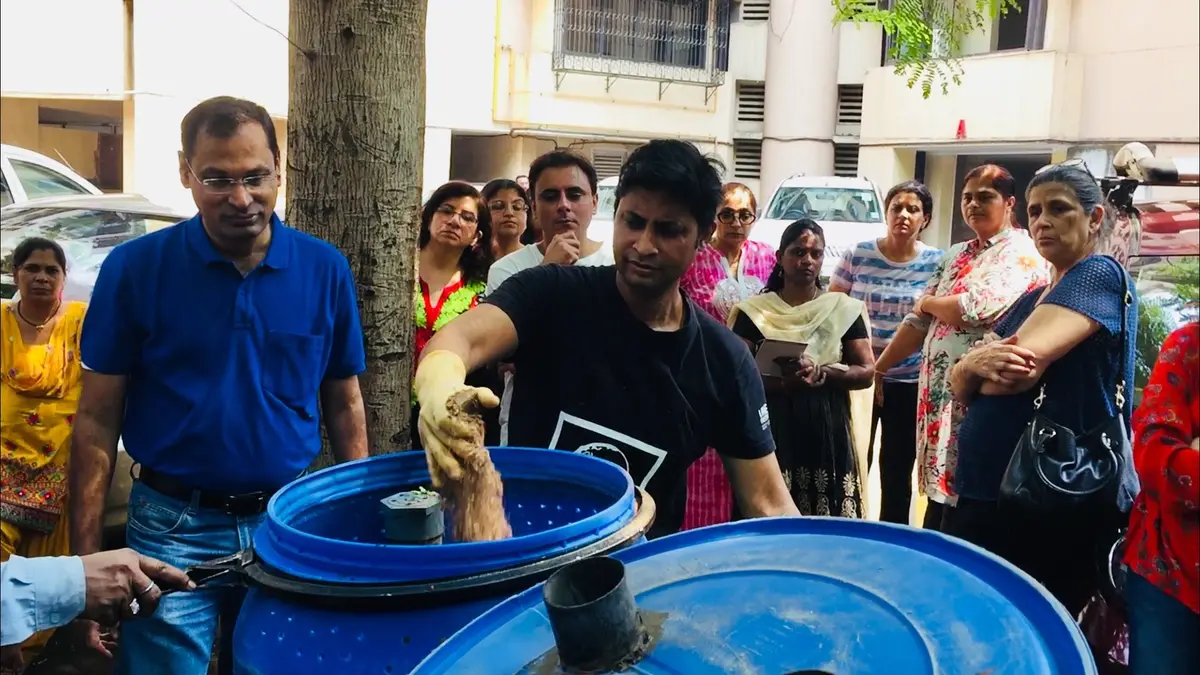
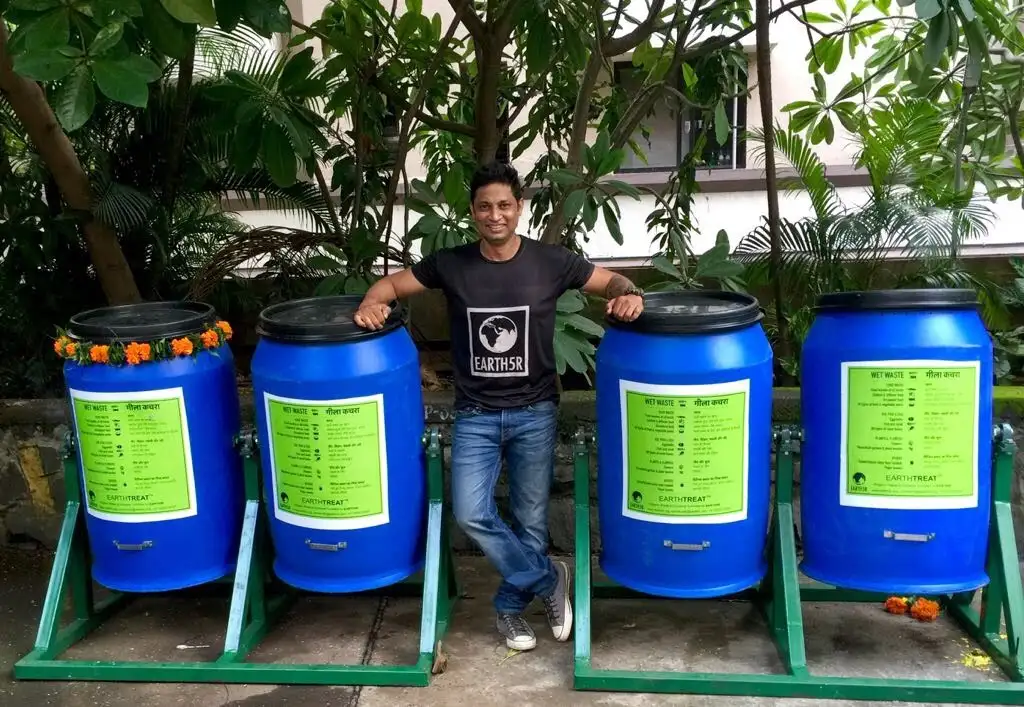
Any city or company plan that leaves out food waste leaves out half the material. Segregating wet waste at source is also what makes the other half clean enough to recycle.
06
Biogas and bio-CNG handle under 1% of India’s waste
In 2020, 61% of India’s solid waste went to landfills. NITI Aayog’s breakdown of the rest shows 28.5% composted, 2.8% incinerated (including as refuse-derived fuel), 0.9% treated by bio-methanation, 0.5% recycled through material recovery facilities and just 0.02% converted to bio-CNG.[4] The same report notes that bio-methanation, bio-CNG and advanced anaerobic digestion produce far less methane than conventional composting and unmanaged disposal.[4]
Where India’s solid waste went, 2020
Share of total solid waste by pathway
Source: NITI Aayog (2026), Sectoral Insights: Waste.[4]
The capacity is growing from a low base. Indore’s Gobar-Dhan plant, opened in 2022 under a public-private partnership with ₹150 crore of private capital, was built to treat 550 tonnes of segregated wet waste a day and produce about 17,000 kilograms of bio-CNG and 100 tonnes of compost daily.[12] On 17 October 2026, the national GOBARdhan portal listed 163 functional CBG or bio-CNG plants and 1,333 functional biogas plants.[13] The government pays Market Development Assistance of ₹1,500 a tonne for fermented organic manure from GOBARdhan plants.[14]
One rule holds for every one of these plants: they only work on clean, segregated wet waste. Earth5R’s decentralised composting model starts at the same point, at the building or neighbourhood.
A biogas plant is only as good as the segregation that feeds it. For developers, food companies and cities, the investable part of food waste is not the technology. It is a reliable stream of clean wet waste.
07
Rotting food is a methane problem, and India’s waste emissions could triple
Food loss and waste generates 8–10% of global greenhouse gas emissions, almost five times as much as aviation, and costs the world economy roughly US$1 trillion a year.[6] When food rots in a dump without air, it produces methane, a gas that warms the planet much faster than carbon dioxide in the short term.
India’s waste sector emitted 75.64 million tonnes of CO₂ equivalent in 2020, 2.56% of national emissions, but more than three times its 1994 level. Methane made up 75.7% of it. Solid waste disposal alone accounted for 19.14 million tonnes.[4] NITI Aayog projects that, under current policy, waste emissions will reach 266.10 million tonnes by 2070. On its net zero path, driven by circularity, universal collection, methane recovery and advanced treatment, they fall to 10.9 million tonnes.[4]
India’s waste-sector emissions, million tonnes CO₂e
2020 inventory and two NITI Aayog scenarios for 2070
Source: NITI Aayog (2026), citing MoEFCC (2024).[4] Waste sector includes solid waste and wastewater.
Open burning is the other risk. Food waste mixed into garbage makes it wet and smelly, and mixed piles are often set alight, as our 10 facts on air pollution in India shows.
For companies with net zero or Scope 3 targets, food waste is one of the few emission sources that can be cut quickly and cheaply, by keeping it out of landfills. The saving only counts if the diverted tonnes are weighed and recorded.
08
Since 1 April 2026, wet waste has a legal destination, and it is not the landfill
The Solid Waste Management Rules, 2026, notified in January and in force since 1 April 2026, make four-stream segregation mandatory. Wet waste includes kitchen and food waste and must be composted or processed through bio-methanation.[16] The rules say plainly that no wet waste may be disposed of in a sanitary landfill.[15] The fee for landfilling unsegregated waste is set higher than the cost of segregating, transporting and processing it.[16]
The biggest change is for bulk waste generators: anyone with a floor area of 20,000 square metres or more, water use of 40,000 litres a day, or waste of 100 kilograms a day. That covers housing societies, hotels, malls, campuses, hospitals and government offices, which together produce nearly 30% of India’s solid waste.[16] They must process wet waste on site where they can, or buy EBWGR certificates where they cannot.[15]
| Who | What the rules require for food (wet) waste | Rule |
|---|---|---|
| Every waste generator | Segregate at source into four streams: wet, dry, sanitary and special care waste. Wet waste includes kitchen, food, vegetable, fruit, meat and flower waste. | Rules 3(1)(zzl) and 5 |
| New bulk waste generators | Set up and run a wet waste processing facility large enough to process all of their wet waste, including horticulture waste. | Rule 6(d) |
| Existing bulk waste generators | Process on site where possible. If not possible, get an exemption from the local body and buy Extended Bulk Waste Generator Responsibility (EBWGR) certificates for the full quantity. | Rules 6(d), 6(f) and 10 |
| Local bodies | Send wet waste to registered processing facilities. No wet waste may go to a sanitary landfill. A weight-based landfill user fee, higher than the cost of collection, transport and processing, applies to unsegregated or unprocessed wet waste. | Rules 8 and 14(4)–(5) |
| Everyone in the chain | Register and report through the CPCB centralised online portal. Environmental compensation applies for violations. | Rules 16 and 17 |
Source: Solid Waste Management Rules, 2026 and the MoEFCC notification of 28 January 2026.[15][16] Summary for information; check the gazette text for obligations.
Our guide to what SWM Rules 2026 change for business sets out thresholds and timelines in more detail.
A housing society or office producing 100 kilograms of waste a day now has a compliance duty for its food waste. Building the composter, training the housekeeping staff and keeping weighed records is cheaper over time than paying someone else to take the waste.
09
India’s ESG disclosure, BRSR, has no line for food waste
Listed companies report waste under Principle 6 of the Business Responsibility and Sustainability Report. The format asks for waste generated in tonnes across plastic, e-waste, bio-medical, construction and demolition, battery, radioactive, other hazardous and “other non-hazardous” waste, with a break-up by composition. For each category, companies report how much was recycled, reused or otherwise recovered, and how much was incinerated or landfilled, and whether any of it was independently assured.[17]
Food waste falls into “other non-hazardous”. A canteen’s food waste, a hotel’s kitchen scraps and a food maker’s rejected batches can all disappear into that one line. The few companies that list organic waste separately, with tonnes composted or sent to biogas, give investors something they can check.
Food waste programmes also fit corporate social responsibility law. Schedule VII of the Companies Act lists eradicating hunger and malnutrition under item (i), and environmental sustainability, conservation of natural resources and soil quality under item (iv).[18] Earth5R’s BRSR reporting services help companies turn field data like this into disclosure.
Food waste is a disclosure gap that a company can close itself. Weighing wet waste at canteens and sites, and reporting it as its own line in the “other non-hazardous” break-up, gives investors and assurers a figure they can verify.
10
Countries that measured first cut food waste by up to 31%
UNEP’s report points to two countries that show change is possible at scale: Japan, which has cut food waste by 31%, and the United Kingdom, by 18%. In the UK, public-private partnerships helped cut household food waste per person by more than a quarter between 2007 and 2018.[6] UNEP credits policies and partnerships, and stresses that robust baselines and regular measurement are what let a country show change.
Few countries have built food waste into climate policy. As of 2022, only 21 countries included food loss or waste reduction in their national climate plans.[6] The global target, Sustainable Development Goal 12.3, calls for halving food waste by 2030,[6] and India does not yet have a nationally representative baseline to track it against.[7]
The countries that cut food waste measured it first, then worked with retailers, caterers and households on specific hotspots. Indian cities and companies can start the same way at ward, campus or society level, without waiting for a national survey.
What cuts food waste in Indian cities, and where Earth5R fits
Measure by weight, not by estimate
The national number is weak because the measurement is weak (facts 1 and 2). A building, canteen or ward that weighs its wet waste for a month has a baseline it can manage. Under the 2026 rules, bulk generators will report these quantities through the CPCB portal anyway.[16]
Segregate at the doorstep
Clean wet waste is what composters and biogas plants run on (fact 6). Segregation is a habit built through training of residents, housekeeping staff and security guards, not through posters. Earth5R’s community-led waste segregation blueprint describes how it works in housing societies.
Process close to the source
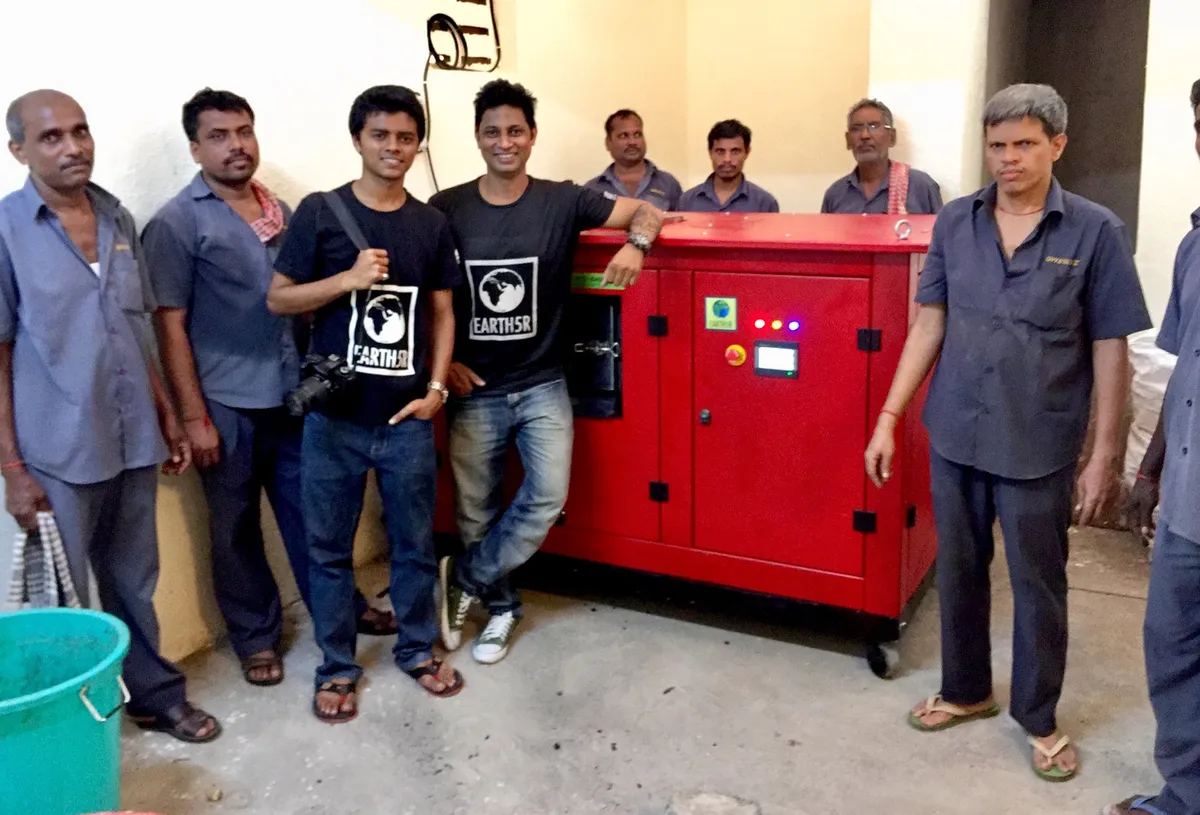
Drum composters, organic waste converters and community composting units keep food waste out of trucks and landfills. Earth5R’s Community Composting Initiative in Mumbai engaged about 10,500 families in segregating waste and composting their organic waste.[19] Our practical steps to urban composting cover the set-up.
Recover the edible surplus, and use the compost
Caterers and event venues can link with registered surplus food agencies.[2] The compost that societies produce can go into gardens, rooftop plantations and farms, closing the loop described in Earth5R’s composting programmes for farmers.
About these figures. The 10,500 families figure and Earth5R’s wider reach figures (98,073 community leaders and 2.5 million citizens mobilised across 150 major city areas) are programme-reported by Earth5R.[20] They have not been independently audited. They show the scale of community engagement, not measured tonnes of food waste diverted, and Earth5R is open to sharing programme data with researchers.
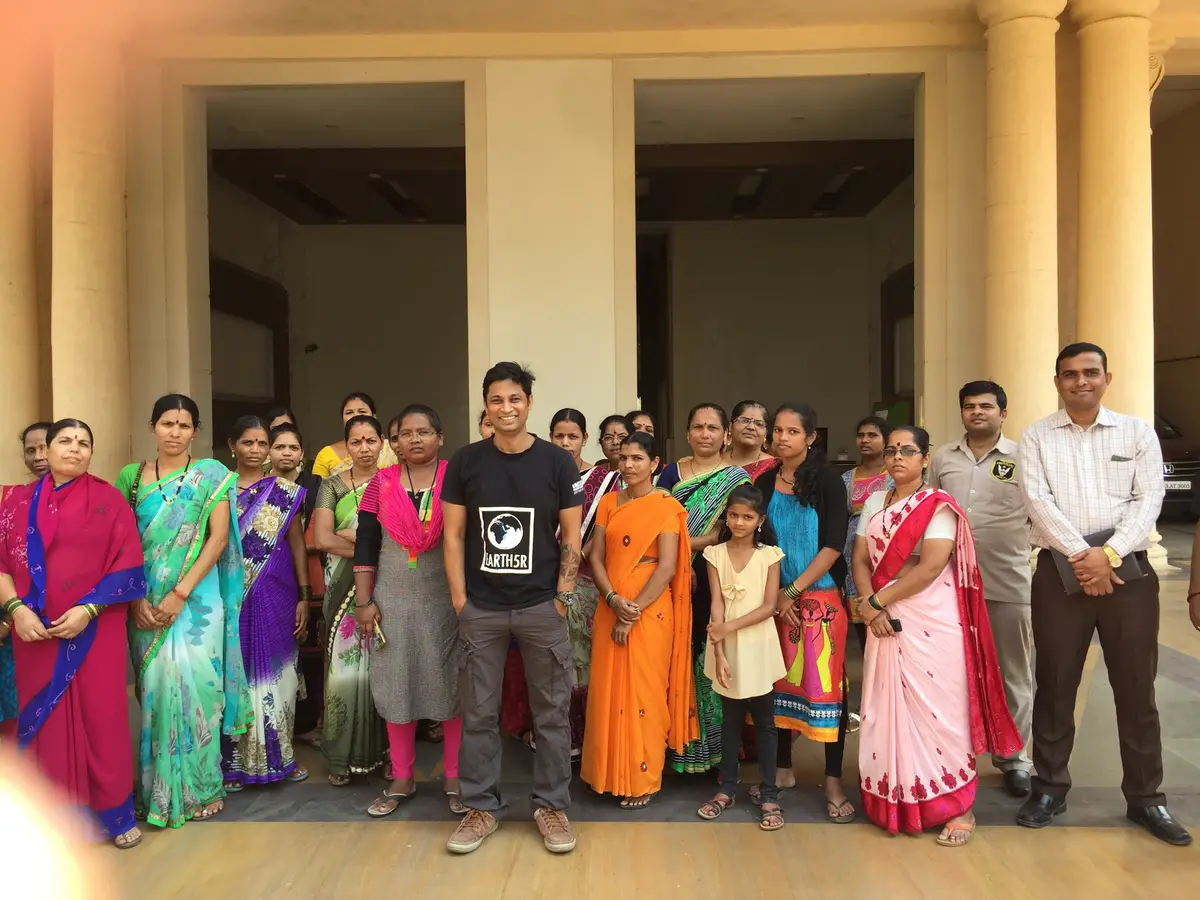
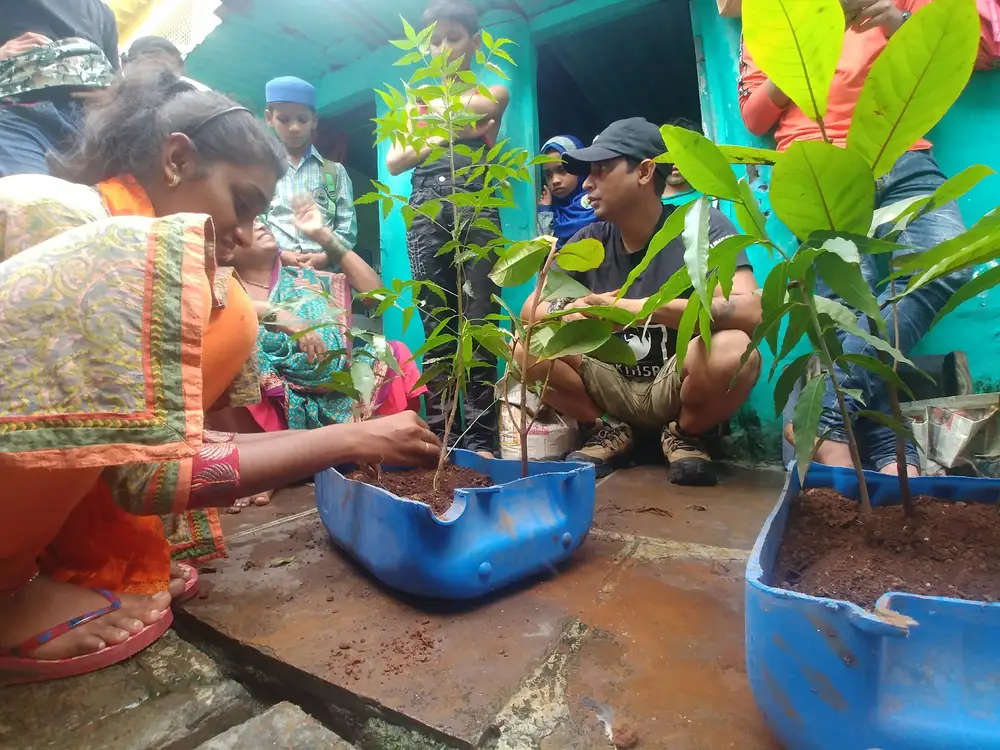
For companies, CSR teams and city agencies, the practical offer is a measured wet waste programme in the buildings, campuses and neighbourhoods where their people work and live. It covers segregation training, on-site composting, weighed data and reporting that fits BRSR and the 2026 rules. See Earth5R’s CSR and ESG projects and field photos in the CSR and NGO work gallery.
Frequently asked questions about food waste in India
- How much food is wasted in India every year?
- UNEP estimates that Indian households wasted about 78.2 million tonnes of food in 2022, or 55 kilograms per person.[1] Adding modelled estimates for food service and retail brings the total to about 138 million tonnes, but those two figures are rated very low confidence.[1]
- Is food waste in India higher than the world average?
- Per person, no. India’s household estimate of 55 kilograms a year is below the world average of 79 kilograms.[2] Because of India’s population, the total is still very large, and the estimate rests on a few local studies.[7]
- What is the difference between food loss and food waste?
- Food loss happens between harvest and retail, on farms, in storage and in transport. In India it is valued at about ₹1.53 lakh crore a year.[3] Food waste happens in shops, restaurants and homes.
- What do the SWM Rules 2026 say about food waste?
- Food waste is wet waste. It must be segregated at source and composted or bio-methanated, and it may not go to a sanitary landfill. Bulk waste generators must process it on site or buy EBWGR certificates.[15][16]
- Who counts as a bulk waste generator?
- Any entity with a floor area of 20,000 square metres or more, water use of 40,000 litres a day or more, or solid waste of 100 kilograms a day or more. This includes housing societies, hotels, malls, institutions and government departments.[16]
- How can a company report food waste in BRSR?
- BRSR has no food waste category, so food waste is reported under “other non-hazardous waste”, with a break-up by composition and the tonnes recovered or disposed of.[17] Reporting organic waste as its own line, based on weighed data, makes it verifiable.
- Does food waste cause climate change?
- Yes. Food loss and waste generates 8–10% of global greenhouse gas emissions.[6] In landfills, rotting food produces methane, the main gas in India’s waste-sector emissions.[4]
Related reading on Earth5R
References
- United Nations Environment Programme (2024). Food Waste Index Report 2024: Appendix, country estimates for household (Section 3.1), food service (3.2) and retail (3.3). wedocs.unep.org
- Ministry of Consumer Affairs, Food and Public Distribution (2025). Lok Sabha Unstarred Question No. 2181, Wastage of Food, answered 12 March 2025. fcainfoweb.nic.in
- Gulati, A., Das, R. and Winter-Nelson, A. Reducing Post-Harvest Losses in Indian Agriculture: A Case Study of Selected Crops. ICRIER–ADMI policy brief. icrier.org
- NITI Aayog (2026). Scenarios Towards Viksit Bharat and Net Zero – Sectoral Insights: Waste. February 2026 (citing MoEFCC, 2024 and CSE, 2022). niti.gov.in
- Welthungerhilfe and Concern Worldwide (2026). Global Hunger Index 2026: Rankings, Scores and Country Data. globalhungerindex.org
- United Nations Environment Programme and WRAP (2024). Food Waste Index Report 2024. Think Eat Save: Tracking Progress to Halve Global Food Waste. Press release, 27 March 2024. unep.org
- Down To Earth (2024). India needs more representative national food waste studies, says latest UN report. 28 March 2024. downtoearth.org.in
- Ministry of Food Processing Industries (2025). Rajya Sabha Unstarred Question No. 572, Wastage of Harvest and Agricultural Produce, answered 7 February 2025 (citing the 2022 NABCONS study; losses for 2020–21). mofpi.gov.in
- Hindustan Times (2024). India loses ₹1.5 lakh crore worth of farm produce each year, study reveals. 5 December 2024. hindustantimes.com
- Food and Agriculture Organization of the United Nations. SDG Indicator 12.3.1(a): Global food losses. SDG Indicators Data Portal. fao.org
- Ministry of Housing and Urban Affairs (2025). Implementation of Swachh Bharat Mission – Urban. Press Information Bureau, 11 December 2025. pib.gov.in
- Prime Minister’s Office (2022). PM inaugurates municipal solid waste based Gobar-Dhan plant in Indore. Press Information Bureau, 19 February 2022. pib.gov.in
- Department of Drinking Water and Sanitation. GOBARdhan Unified Registration Portal, dashboard figures, accessed 17 October 2026. gobardhan.sbm.gov.in
- Ministry of Agriculture and Farmers Welfare (2025). Benefits of Organic Farming. Press Information Bureau, 11 February 2025. pib.gov.in
- Ministry of Environment, Forest and Climate Change (2026). Solid Waste Management Rules, 2026. Gazette notification; copy hosted by the Maharashtra Pollution Control Board. Rules 3(1)(zzl), 5, 6, 8, 10, 14, 16 and 17. mpcb.gov.in
- Ministry of Environment, Forest and Climate Change (2026). New Solid Waste Management Rules Notified; To Come into Force from April 1, 2026. Press Information Bureau, 28 January 2026. pib.gov.in
- Securities and Exchange Board of India (2021). Business Responsibility and Sustainability Reporting Format, Annexure I, Principle 6, Essential Indicator 8. sebi.gov.in
- Companies Act, 2013, Schedule VII: Activities which may be included by companies in their Corporate Social Responsibility policies, items (i) and (iv). ca2013.com
- Earth5R. Community Composting Initiative, Mumbai. Programme report. earth5r.org
- Earth5R. CSR and NGO Work Gallery: programme reach figures. Programme-reported. earth5r.org
How to cite this article
Earth5R (2026). Food Waste in India in 2026: 10 Facts on Homes, Farms, Landfills and the New Rules. EarthJournal, Earth5R, 17 October 2026. https://earth5r.org/food-waste-in-india/
Figures are taken from the sources cited and were current on 17 October 2026. UNEP’s food service and retail estimates for India are modelled, very low confidence figures. Earth5R figures are programme-reported. The summary of the SWM Rules, 2026 is for information and is not legal advice.