
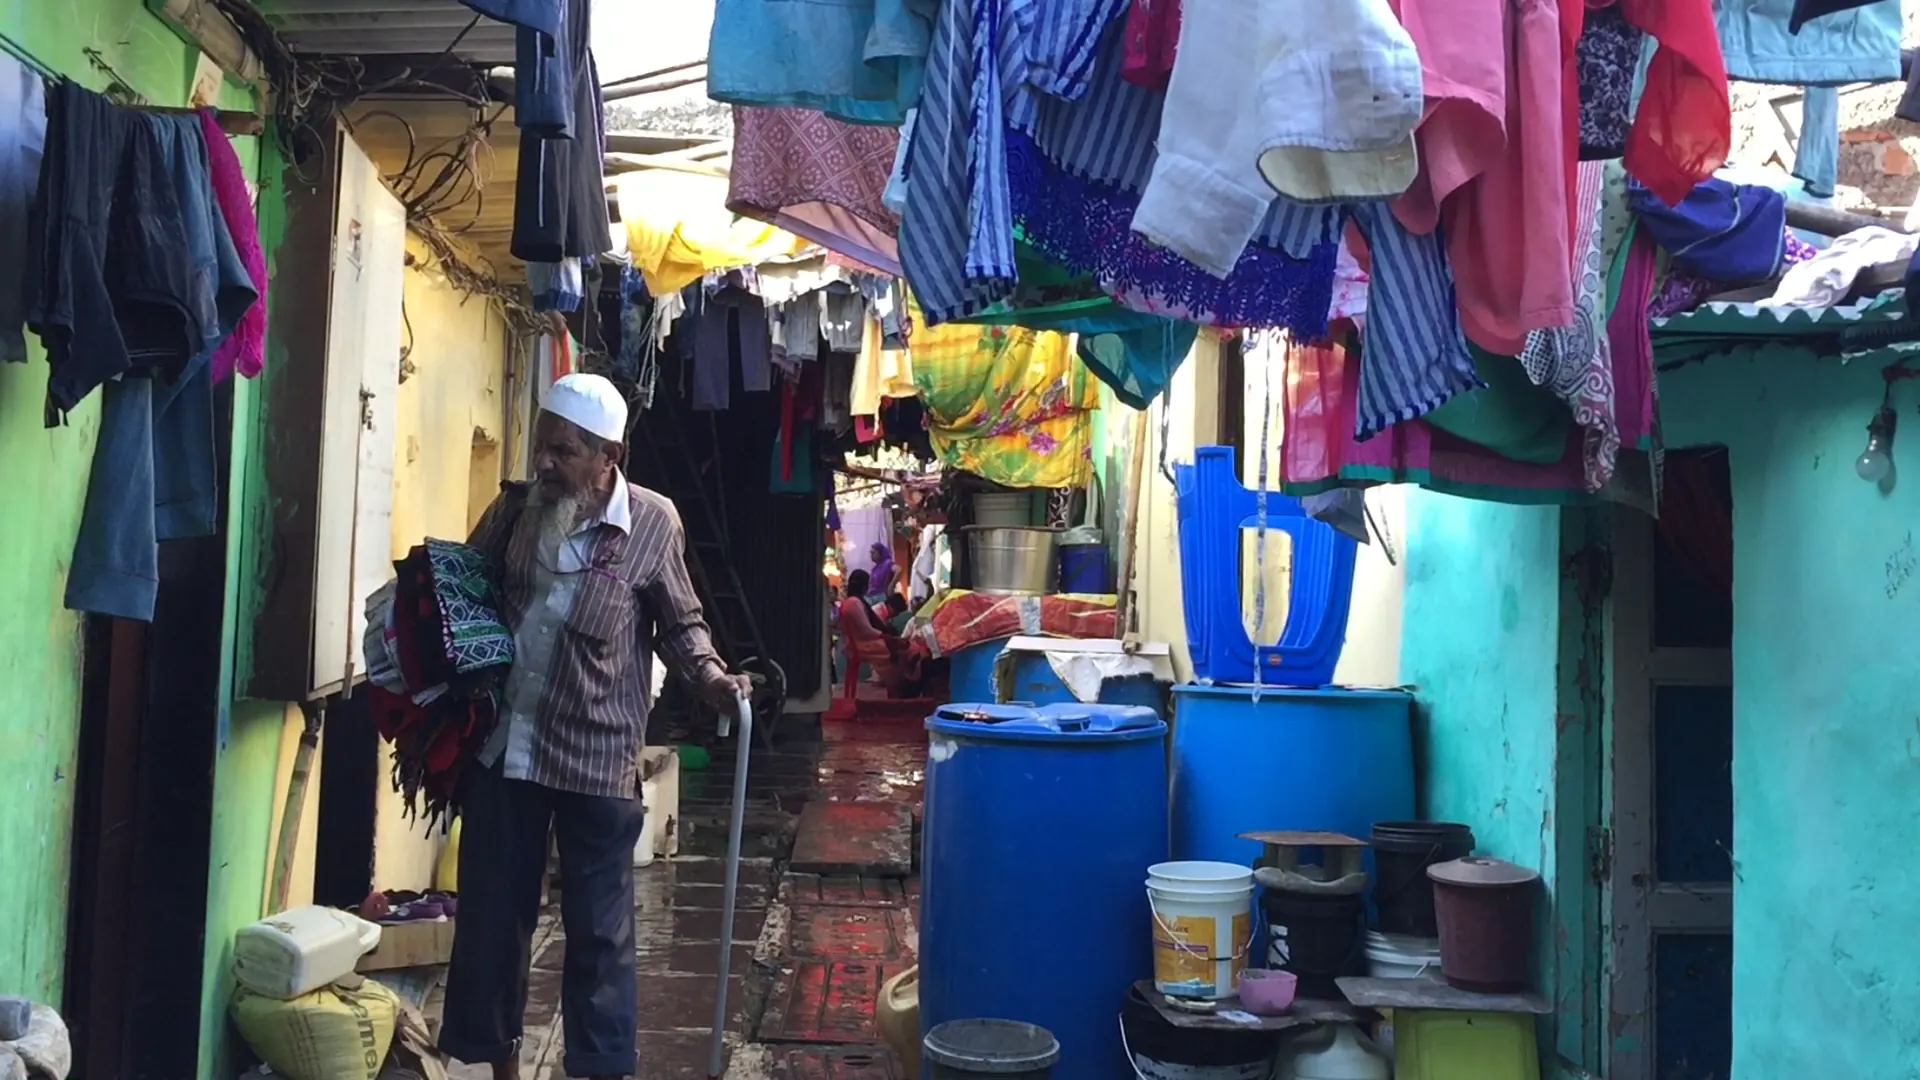
India draws more groundwater than any other country, and the 2026 monsoon has just ended 13% short. This research brief uses the 2025 national groundwater assessment, the latest national water quality data and IMD’s end-of-season figures to show where groundwater depletion in India is worst, what is polluting the water that remains, and which fixes are working on the ground, from village water budgets to building-level rainwater harvesting.
Groundwater depletion in India: the findings at a glance
- India pumps more groundwater than any other country
- 730 units draw more than they recharge
- Punjab, Rajasthan and Haryana pump 1.4 to 1.6 times their limit
- The national numbers improved, but half of wells fell
- The 2026 monsoon ended 13% short
- One in five samples breaks the nitrate limit
- Cities rely on groundwater for half their water
- Where villages measured their water, 180 of 229 blocks improved
- Only about 8% of farmland uses drip or sprinkler
- Companies must now disclose groundwater use
- The five R’s applied to groundwater
- Earth5R’s field evidence
- What to do before the 2027 monsoon
- Questions
Working on water at a site or in a catchment? Earth5R’s free Water Stewardship Guide covers groundwater risk, CGWA rules and the BRSR water balance in 21 pages.
01
India pumps more groundwater than any other country, about 247 billion cubic metres a year
The Central Ground Water Board (CGWB) and the states assess India’s groundwater every year. The 2025 assessment puts total annual recharge at 448.52 billion cubic metres (bcm). After allowing for natural discharge, 407.75 bcm can be extracted, and the country actually extracted 247.22 bcm.[1] One bcm is a cubic kilometre, or a lakh crore litres.
The UN’s World Water Development Report 2022 names India as the largest groundwater user in the world, at about 251 cubic kilometres a year in its dataset, with 89% going to irrigation.[4] Groundwater now meets about 64% of India’s irrigation needs, about 85% of rural water supply and about 50% of urban water use.[1]
Nearly all of it goes to farms. Of the water extracted in 2025, 87% went to irrigation, 11% to domestic use and 2% to industry.[1] Worldwide the split is 69% for agriculture, 22% for domestic use and 9% for industry,[4] so India’s groundwater is far more concentrated on fields than the global average.
Where India’s groundwater goes, 2025
Annual extraction by use, billion cubic metres (bcm) and share of the total
Source: CGWB, National Compilation on Dynamic Ground Water Resources of India, 2025.[1] Total extraction 247.22 bcm.
Any serious plan on groundwater depletion in India is first a farm plan. Industry’s 2% share is small nationally, but one factory can be a large share of one block, which is why the local category of a site matters more than the national average.
02
730 of India’s 6,762 assessment units draw more groundwater than they recharge
CGWB grades each assessment unit, which is a block, mandal, taluk or firka depending on the state, by its stage of extraction. That is the share of the extractable groundwater that is actually being used. A unit at 70% or less is safe. Above 70% and up to 90% is semi-critical, above 90% and up to 100% is critical, and above 100% is over-exploited.[1]
In 2025, 730 units (10.80%) were over-exploited, 201 (2.97%) critical and 758 (11.21%) semi-critical. 4,946 units (73.14%) were safe, and 127 (1.88%) were classed as saline.[1] The over-exploited units cover about 4.16 lakh square kilometres, 16.85% of the area assessed, and hold 44.66 bcm, or 10.95%, of the country’s extractable groundwater.[1]
The report finds three clusters. In the north-west, in parts of Punjab, Haryana, Delhi and western Uttar Pradesh, recharge is abundant but “indiscriminate withdrawals” have caused over-exploitation. In the west, in Rajasthan and Gujarat, the arid climate limits recharge itself. In the southern peninsula, in parts of Karnataka, Tamil Nadu, Telangana and Andhra Pradesh, hard-rock crystalline aquifers simply hold less water.[1]
Stage of groundwater extraction by state, 2025
Share of extractable groundwater actually used. Selected states and union territories with the national figure. Dashed lines mark the 70% and 100% thresholds.
Source: CGWB, Dynamic Ground Water Resources of India, 2025, state-wise table.[1]
A national stage of extraction of about 60% hides blocks running well past 100%. CSR water projects and corporate water risk screens should start from the published CGWB category of the specific block, not the state or national figure.
03
Punjab, Rajasthan and Haryana pump 1.4 to 1.6 times what their aquifers can give
Only three states have a stage of extraction above 100%. Punjab extracted 26.27 bcm in 2025 against 16.80 bcm that can be extracted sustainably, a stage of 156.36%, and 24.89 bcm of that went to irrigation. Rajasthan stands at 147.11% and Haryana at 136.75%.[1] In Haryana, 91 of 143 units are over-exploited.[5]
Punjab’s gap between what it pumps and what it can sustainably draw is about 9.5 bcm a year, more than twice what all of Indian industry extracts (4.23 bcm).[1] The cause is not a lack of rain. CGWB describes the north-western cluster as one where recharge is abundant and withdrawal is the problem.[1]
Depletion in the north-west also shows up in water quality. In CGWB’s 2024 uranium survey of 3,754 samples, 6.71% of pre-monsoon and 7.91% of post-monsoon samples nationally were above 30 parts per billion. In Punjab the shares were 53.04% and 62.50%, with Haryana at 15% to 23.75% and Delhi at 13% to 15.66%. CGWB says the north-western hotspot is “likely due to geogenic factors, groundwater depletion, and aquifer characteristics”.[2]
In the north-west, groundwater depletion is a question of what is grown and how it is watered. Recharge alone cannot close a 9.5 bcm gap. Crop choice, irrigation scheduling and drip systems that farmers can maintain are where the water is.
04
The national numbers have improved since 2017, but half of monitored wells were below their ten-year average
On paper, India’s groundwater has been recovering. Between the 2017 and 2025 assessments, annual recharge rose from 431.86 bcm to 448.52 bcm and the stage of extraction fell from 63.33% to 60.63%. Safe units rose from about 63% to 73.14% of the total, and over-exploited units fell from about 17% to 10.80%.[5][6] The CGWB report credits “good continuous rainfall” in some areas, along with recharge and conservation work under central and state programmes.[1]
Extraction has not fallen, though. It rose from 245.64 bcm in 2024 to 247.22 bcm in 2025. Recharge rose a little faster, from 446.9 bcm to 448.52 bcm.[1] The water levels in wells give a more mixed picture. When pre-monsoon 2024 levels were compared with the 2014 to 2023 average, 50.3% of the monitored wells (6,811 of them) showed a decline and 49.6% a rise.[1]
Better categories, mixed wells
Share of assessment units, stage of extraction, and share of monitored wells below their decadal mean
Source: Lok Sabha Unstarred Question 908, July 2026, and PIB, January 2026, for 2017 and 2025 categories.[5][6] Well levels: CGWB 2025 assessment, pre-monsoon 2024 against the 2014 to 2023 mean.[1]
The direction of the national numbers is good news. But a falling well is a local fact for the family or farm that depends on it. Progress should be judged block by block and well by well, and any recharge programme should report the wells it watches.
05
The 2026 monsoon ended 13% short, and the east and south took the biggest hit
Rain is the aquifer’s main income. Rainfall provides about 60% of India’s annual groundwater recharge, 269.17 bcm in 2025, and more than 75% of the year’s rain falls between June and September.[1] So the monsoon that ended on 30 September matters for next year’s wells.
The India Meteorological Department reports that India received 759.4 mm of rain from June to September 2026, 87% of the long period average of 868.6 mm. That makes it the fourth lowest since 2001 and the 13th lowest since 1901. The South Peninsula got 76% of normal, its fourth lowest since 1901, and East and North East India got 74%, the lowest since 1901. North-west India received 94% and central India 97%. In all, 17 of 36 meteorological sub-divisions, covering 42% of the country’s area, were deficient.[3] The season also started badly, with June at 65% of normal, July at 101%, August at 84% and September at 92%.[3]
2026 southwest monsoon rainfall by region
Percentage of the long period average, June to September 2026
Source: India Meteorological Department, press release, 30 September 2026.[3]
The south is where a weak monsoon bites fastest. Its crystalline hard-rock aquifers hold little water to begin with.[1] Heat adds to the pressure. A 2023 study in Science Advances found that Indian farmers pump more groundwater as temperatures rise, and projected that, with continued warming, depletion rates in 2041 to 2080 could be about three times today’s (3.26 times, with a range of 1.62 to 4.45 across scenarios).[7]
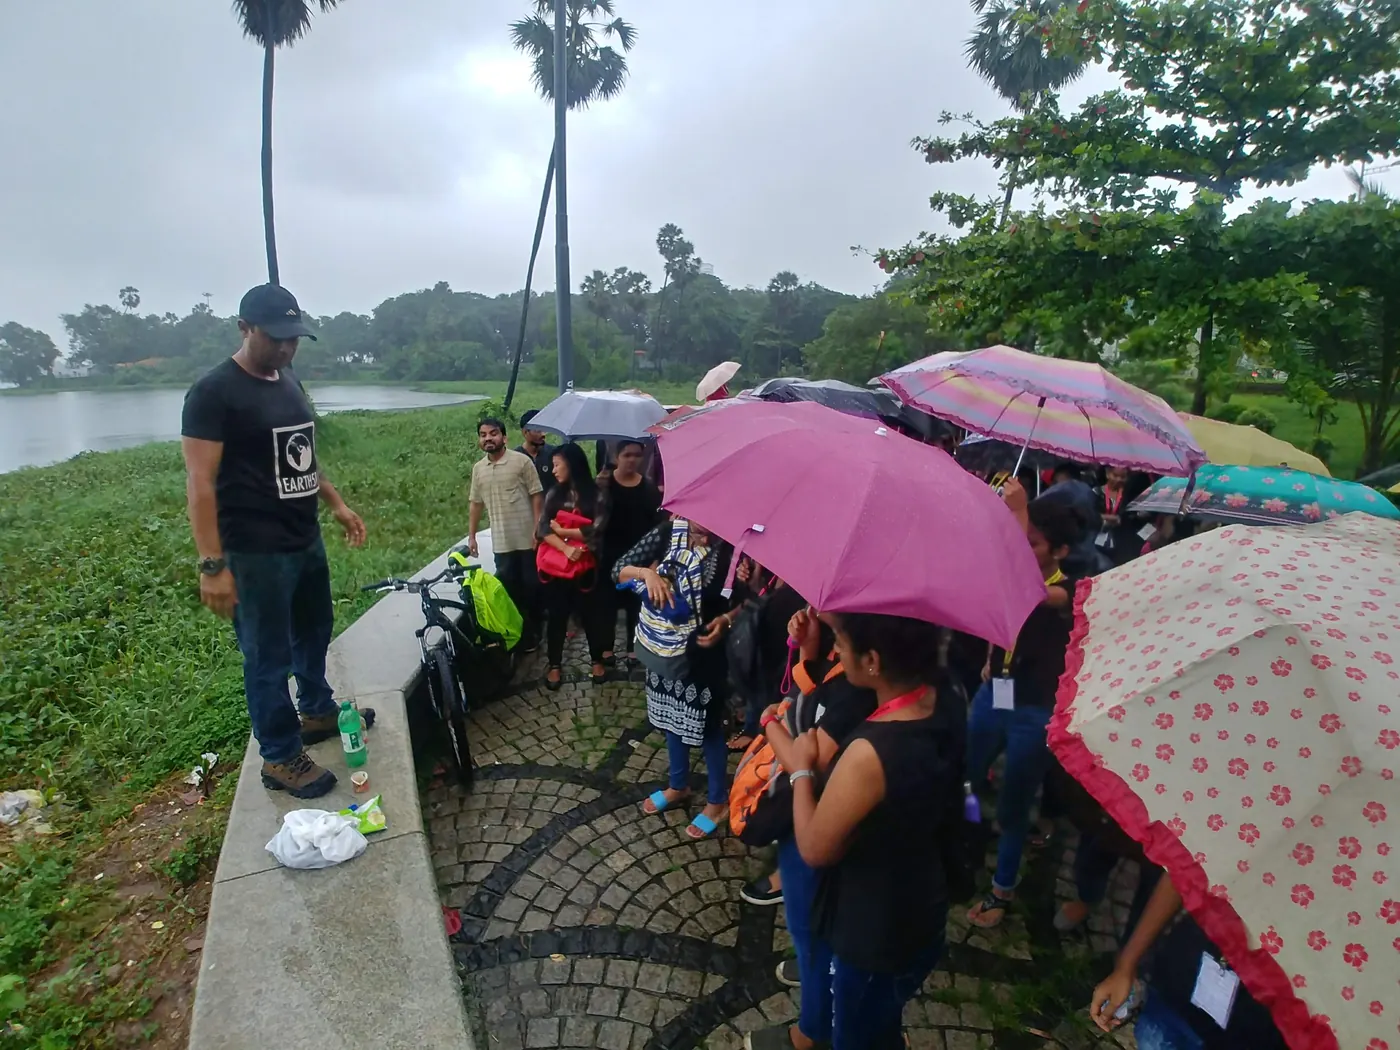
Expect the 2027 pre-monsoon well readings in the south and east to show this year’s shortfall. Recharge pits cleaned, tanks desilted and rooftops connected before June 2027 will be worth more than usual, because the aquifers they feed start the season lower.
06
One in five groundwater samples breaks the drinking water limit for nitrate
Less water is one problem. Dirtier water is the other. CGWB’s Annual Ground Water Quality Report 2025 tested 14,978 samples taken before the 2024 monsoon. 71.7% met the Bureau of Indian Standards limits on every parameter tested, and 28.3% exceeded at least one.[2] The government’s summary is that groundwater is “largely potable with localized occurrences” of contamination.[8]
Nitrate is the most widespread problem. 20.71% of samples were above 45 mg/L, a share that has stayed between 19.5% and 21.3% every year since 2017. The report links high nitrate to intensive farming, excessive fertiliser use and the poor disposal of domestic and animal waste. In the Indo-Gangetic plains it points to “unlined sanitation systems” and leaching from fields.[2] In some states the share is far higher. Of the samples tested, 325 of 643 in Rajasthan, 181 of 398 in Karnataka, 337 of 929 in Tamil Nadu and 531 of 1,565 in Maharashtra were above the nitrate limit.[2]
Share of groundwater samples above the BIS limit, pre-monsoon 2024
Selected parameters, 14,978 samples analysed for basic parameters (fewer for some trace metals)
Source: CGWB, Annual Ground Water Quality Report 2025.[2] The uranium figure is from the trace metal set. The separate uranium survey of 3,754 samples found 6.71% above 30 ppb before the monsoon.
Salinity is creeping up too. The share of samples with high electrical conductivity rose from 5.54% in 2017 to 7.23% in 2024, and fluoride was above the limit in 8.05%.[2]
Depletion and pollution are one problem seen from two sides. Overused fertiliser, open drains and leaking septic systems feed the nitrate in wells, so cutting fertiliser, segregating waste and treating sewage are groundwater work as much as pumping less is.
07
Cities rely on groundwater for about half their water, and Delhi already uses 92% of its share
Groundwater meets about half of urban water use in India.[1] Delhi’s stage of extraction is 92.10%, in the critical band.[1] Of its 34 assessment units, 10 are over-exploited and 11 more are critical.[5] Puducherry is at 75.98% and Chandigarh at 67%.[1]
Demand from homes will keep rising. The 2025 assessment sets aside 36.42 bcm for domestic use in 2035, against the 27.89 bcm drawn for domestic use today.[1] City sinking is often linked to over-pumping in news reports, but in July 2026 the Ministry of Jal Shakti told Parliament that land subsidence is localised and that it has no state-wise attribution of subsidence to groundwater extraction.[5] The firmer evidence for cities is in the extraction numbers.
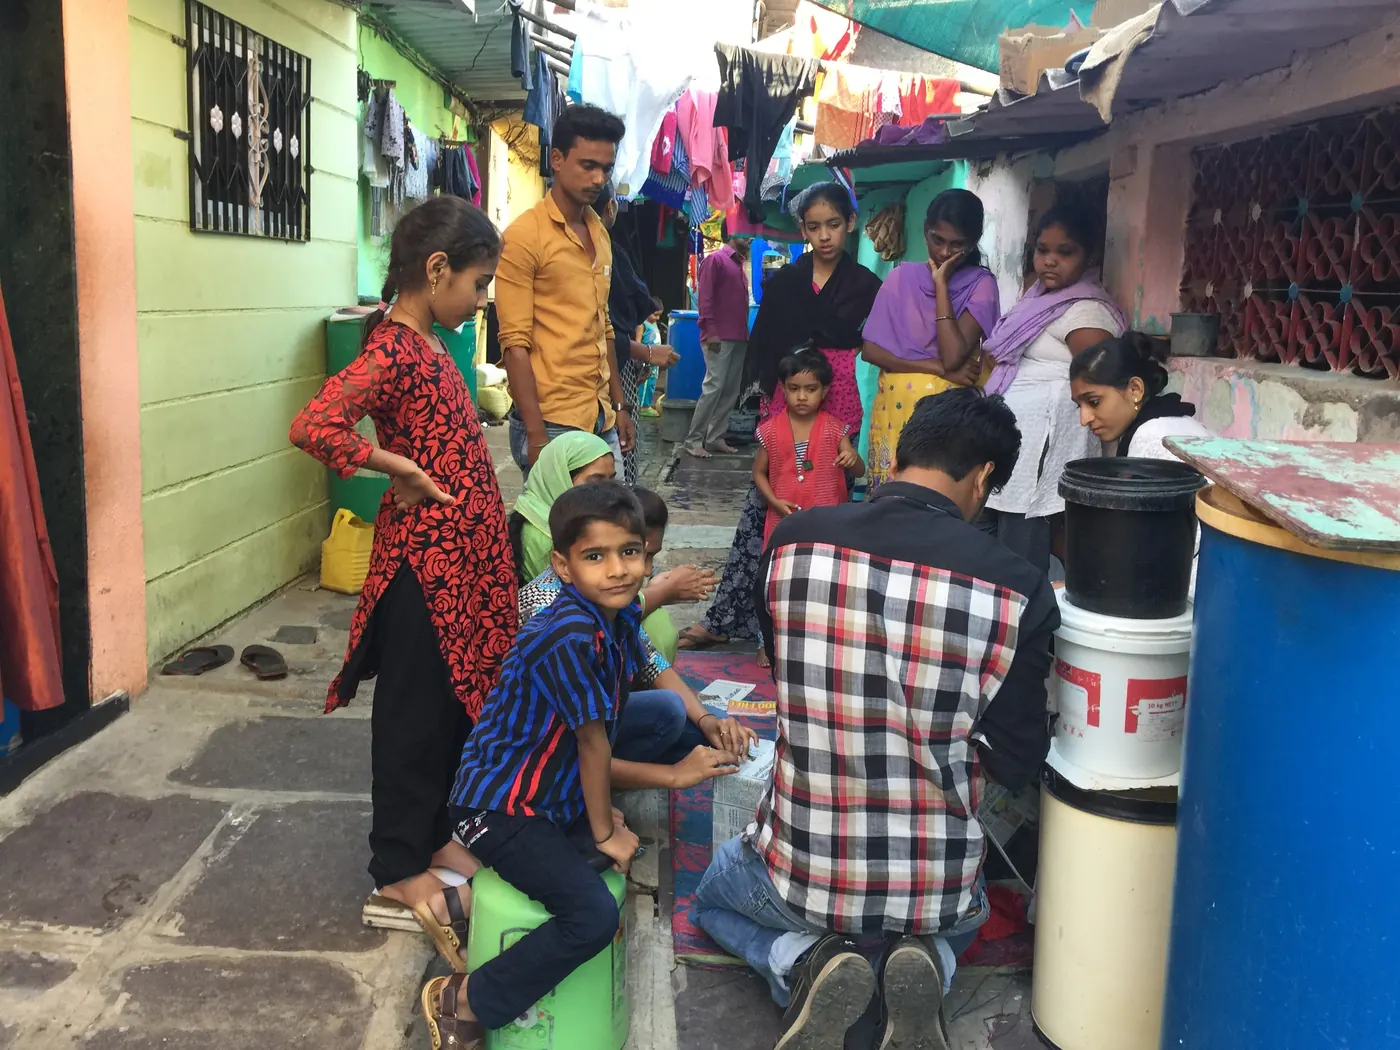
Buildings can do a lot within their own walls. In Earth5R’s urban water conservation programme, buildings that adopted conservation measures cut their water use by an average of 5,800 litres a month, a 24% to 28% reduction, through rainwater harvesting, wastewater recycling and fixture upgrades.[9] The full case study and the field evidence section below give the details.
City water plans should count borewells and recharge pits the way they count pipes. Rooftop rainwater harvesting and the reuse of treated wastewater in large buildings are levers that a housing society, a campus or a company controls directly.
08
Where villages measured their own water, 180 of 229 blocks improved
India has built recharge structures at a scale few countries match. More than 2 crore water conservation and artificial recharge works have been carried out through the Jal Shakti Abhiyan since 2019. The Jal Sanchay Jan Bhagidari initiative, launched in 2024, has added more than 1.55 crore recharge and storage works, and nearly 69,000 Amrit Sarovars have been built or revived.[5] About ₹1.5 lakh crore has been spent on this since 2021 through convergence with MGNREGS alone, and the Master Plan for Artificial Recharge of Groundwater, 2020 envisages about 1.42 crore structures to harness 185 bcm of monsoon rainfall.[8] Since September 2025, at least 65% of MGNREGS funds in over-exploited and critical blocks, and 40% in semi-critical blocks, must go to water works.[6]
The Atal Bhujal Yojana tried something different. From April 2020 to October 2025 it worked on the demand side in 8,203 gram panchayats across 229 blocks, 80 districts and seven states. Every gram panchayat prepared a water budget and a water security plan, updated each year. There were more than 1.28 lakh gram panchayat level trainings, NGOs served as district implementation partners, and at least 33% participation by women in decision-making was mandatory. Communities monitored around 70,000 wells and shared the data publicly, mapped more than 99,000 existing structures, and brought around 9.7 lakh hectares under drip, sprinkler, mulching or crop diversification.[10] In the 2023 to 2025 assessment, 180 of the 229 blocks showed improved groundwater levels, including 39 of 43 in Maharashtra.[10]
| Approach | What it does | Scale or result | What it needs to work |
|---|---|---|---|
| Recharge (supply side) | Ponds, check dams, recharge pits, rooftop harvesting | More than 2 crore works under JSA, 1.55 crore under JSJB[5] | Maintenance, desilting and measured recharge, not just a count of structures |
| Water budgets (demand side) | Villages measure, plan and cut use | 180 of 229 Atal Bhujal blocks improved[10] | Trained local people, public well data, women in decisions |
| Efficient irrigation | Drip, sprinkler, scheduling, crop choice | 115 lakh hectares under micro-irrigation[11] | Repair skills, credit and farmer groups |
| Regulation and disclosure | Permits, charges, company reporting | CGWA rules in 19 states and UTs, BRSR water lines[5][12] | Block-level data and public scrutiny |
Table: Earth5R synthesis of the sources cited in each row.
Earth5R has written about how small structures add up in micro-watershed water harvesting and in community-driven rainwater harvesting.
Structures add storage. Budgets change behaviour. The Atal Bhujal results suggest the two work best together, with the community holding the measuring tape. A CSR recharge project should fund the monitoring and the maintenance, not only the concrete.
09
Only about 8% of India’s farmland is under drip or sprinkler irrigation
With 87% of extraction going to irrigation, the biggest saving sits on farms. Per Drop More Crop, the national micro-irrigation scheme, had brought more than 115 lakh hectares under drip and sprinkler irrigation by July 2026. That is about 8.11% of India’s net sown area. Around half of the net sown area is irrigated at all. The scheme pays 55% of the cost for small and marginal farmers and 45% for others.[11]
Earth5R’s agriculture programme shows why the hardware alone is not enough. Between 2018 and 2025, Earth5R volunteers and community leaders trained 12 lakh farmers across 14 states and 2 union territories in five practices together: organic practice, drip irrigation, residue management, solar pumping and financial literacy.[13] The case study is blunt about the problem. “Groundwater is pumped beyond replacement because flood irrigation is what the equipment allows,” it says, and “a farmer who installs drip irrigation but has no savings cannot replace an emitter when it fails.”[13]
So the training was held on the plot, in the season the practice applies to, with the trainer travelling and the farmer staying on the land. Farmer cooperatives, not individuals, were the unit of adoption, so that equipment and confidence could be shared. Trained farmers reported using 40% less synthetic fertiliser. Earth5R states that this figure is self-reported and was not soil tested.[13] If it holds, it also matters for the nitrate in section 06.
Drip systems save water only while they keep working. Programmes that pair subsidy with repair skills, group finance and in-season training at the plot turn a one-time installation into a lasting change. Read the full Earth5R agriculture case study.
10
Listed companies must disclose how much groundwater they draw, and new large industry is barred in over-exploited blocks
Industry draws only 2% of India’s groundwater,[1] but it faces the sharpest rules. SEBI’s Business Responsibility and Sustainability Report (BRSR) asks listed companies to report water withdrawal by source, with groundwater as its own line, along with total consumption and water intensity. A leadership indicator asks for the same figures for sites in areas of water stress.[12]
The Central Ground Water Authority’s guidelines of 24 September 2020 brought in higher extraction charges and heavier environmental compensation for illegal use, and they prohibit new large-scale industries in over-exploited blocks.[6] CGWA regulates extraction by industry and infrastructure projects in 19 states and union territories. The other 17 have their own regulatory frameworks.[5] For CSR, Schedule VII of the Companies Act lists conservation of natural resources and maintaining the quality of soil, air and water as eligible activities.[14]
Earth5R’s ESG and BRSR reporting services cover the BRSR water lines, and our analysis of data centres and water in India shows how a new industry adds to local demand.
For a company, groundwater depletion in India is now a disclosure, a licence and a local reputation issue at once. A site in an over-exploited block that cannot show its withdrawal and its community water work will find all three harder to hold.
Earth5R’s five R’s, applied to groundwater
Earth5R’s name comes from a sequence it has taught since 2014: Respect, Reduce, Reuse, Recycle, Restore. “The order matters,” Earth5R founder Saurabh Gupta writes. “Respect comes first, respect for nature, for communities and for the limits of growth.”[15] For groundwater, each R points to a concrete task.
| The R | What it means for groundwater | Where Earth5R does it on the ground |
|---|---|---|
| Respect | Start from the limit. A block’s CGWB category and its water budget tell you what the aquifer can give before anyone plans to draw more. | Door-to-door volunteers explaining scarcity to residents, building by building[9] |
| Reduce | Pump less: drip and scheduled irrigation on farms, low-flow fixtures and leak fixes in buildings. | Drip irrigation training for 12 lakh farmers[13], an average 5,800 litres a month saved per adopting building[9] |
| Reuse | Use treated wastewater for flushing, gardens and cooling, so less fresh water is drawn from the ground. | 2,610+ buildings that adopted wastewater recycling[9] |
| Recycle | Close the loop on waste and nutrients so they do not leach into aquifers as nitrate and other pollutants. | Paid collection of segregated plastic in the Mithi catchment, fertiliser cuts reported by trained farmers[16][13] |
| Restore | Rebuild the recharge system: lakes, ponds, green cover and rooftops connected to the ground. | 3,840+ rainwater harvesting systems[9], the Powai Lake and Mithi River programmes[17] |
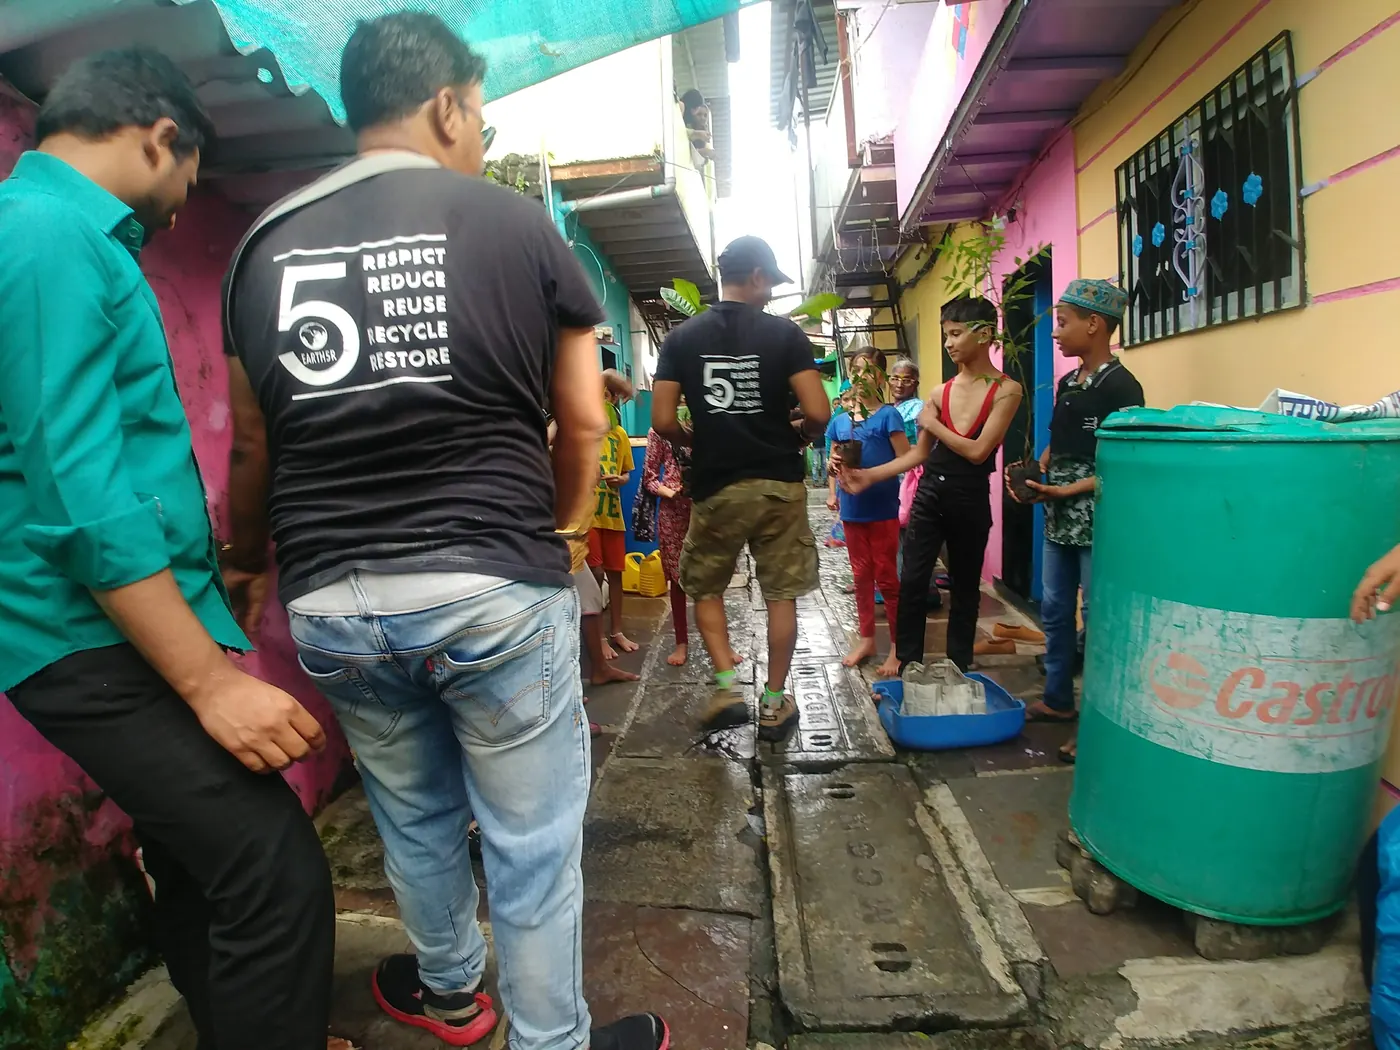
The order is the point. A programme that starts at Recycle has skipped the three most important steps.[15] A recharge pit built in a block that keeps pumping at 150% of its limit is Restore without Respect or Reduce.
What Earth5R’s field programmes show about groundwater work that lasts
Case study 1: door-to-door water conservation in urban buildings, 2015 to 2025
Earth5R’s urban water conservation programme ran across 28 states and 8 union territories from January 2015 to December 2025. It grew from 1,800 volunteers reaching 7,200 buildings in 2015 to 4,800 trained volunteers and more than 4,90,000 buildings reached by 2025. More than 34,300 buildings adopted conservation measures, an average adoption rate of 7%. Programme records count more than 3,840 rainwater harvesting systems and more than 2,610 buildings that adopted wastewater recycling, with 16.9 billion litres of water saved in total.[9]
Three findings are useful for anyone designing a groundwater programme. First, awareness is not action. By 2023, 82% of urban residents surveyed saw water scarcity as a serious local problem, yet only 6.8% had adopted any conservation technology in their building. Second, the door-to-door volunteer model produced adoption rates three to four times higher than mass media campaigns alone. Third, buildings that combined rainwater harvesting, wastewater recycling and fixture upgrades saved 2.3 times as much water as those that adopted one method. The programme names its main constraint as keeping volunteers.[9]
Case study 2: Powai Lake and the Mithi River, Mumbai
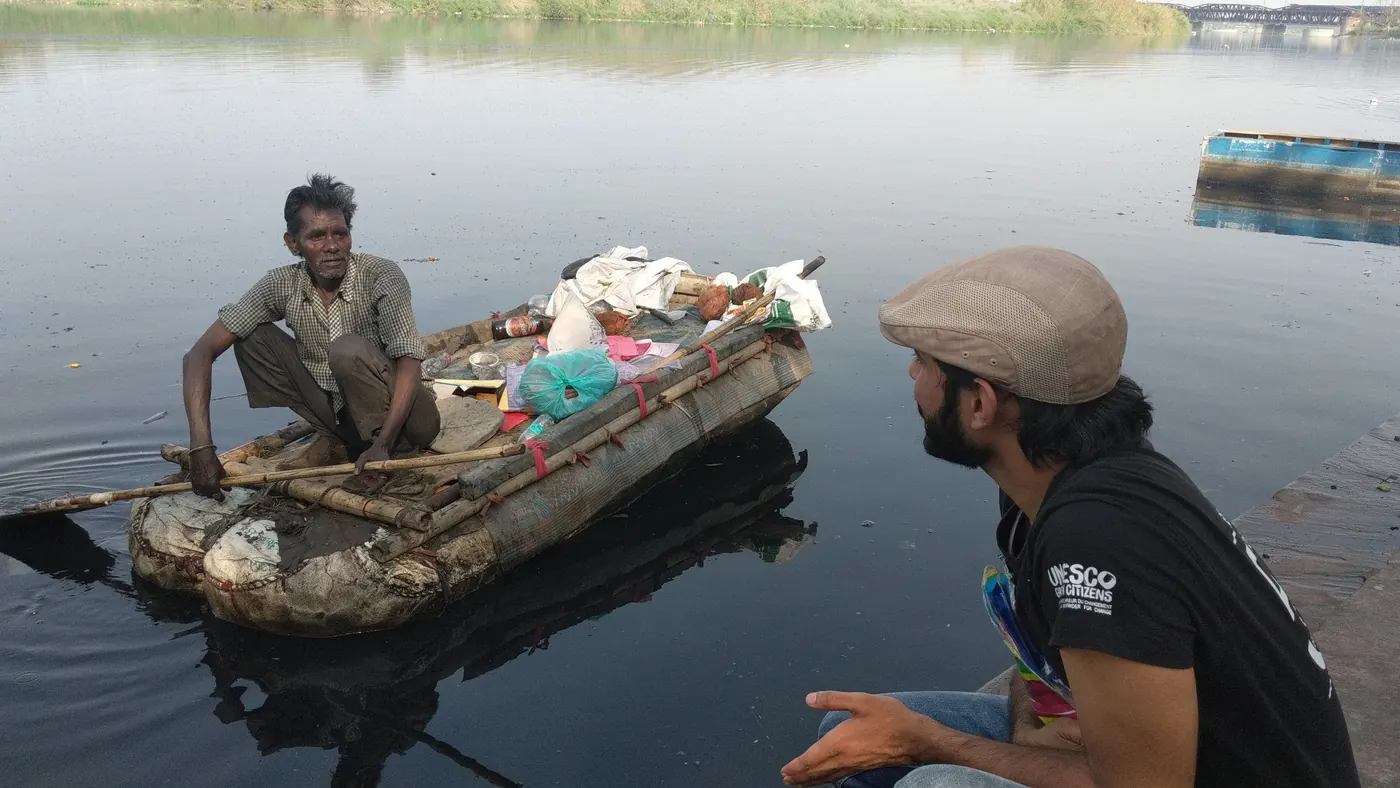
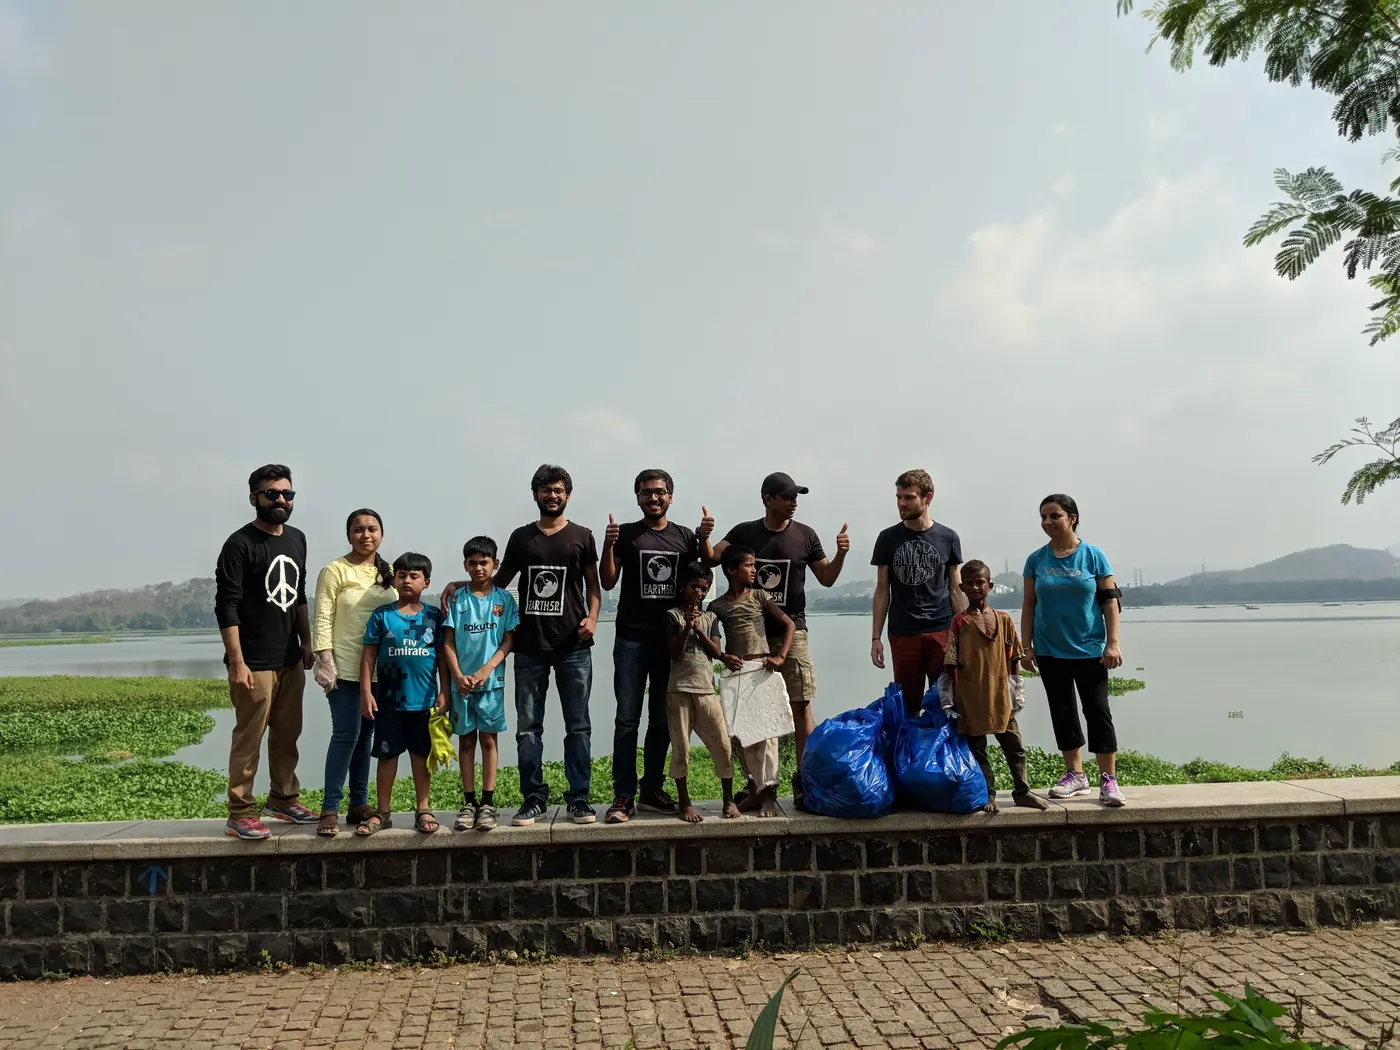
Lakes and rivers are part of the recharge system, and keeping waste and sewage out of them protects the water below. At Powai Lake, Earth5R ran a cleanup every Sunday for 208 consecutive weeks, with an average of 70 volunteers, held 208 educational events reaching more than 50,000 residents, and brought more than 50 local waste collectors into the work. Dumping at the lake fell by 35%.[17] On the Mithi River, from October 2020 to November 2024, the programme removed 11,100 tonnes of waste, including 4,440 tonnes of plastic, trained 10,000 families and 500 businesses in the catchment, and worked with 15,000 volunteers. Residents were paid for segregated plastic, which turned collection into income.[16] Earth5R’s ecosystem approach to urban lakes and the river cleanup CSR project describe the model in full.
Case study 3: farmers trained at the plot
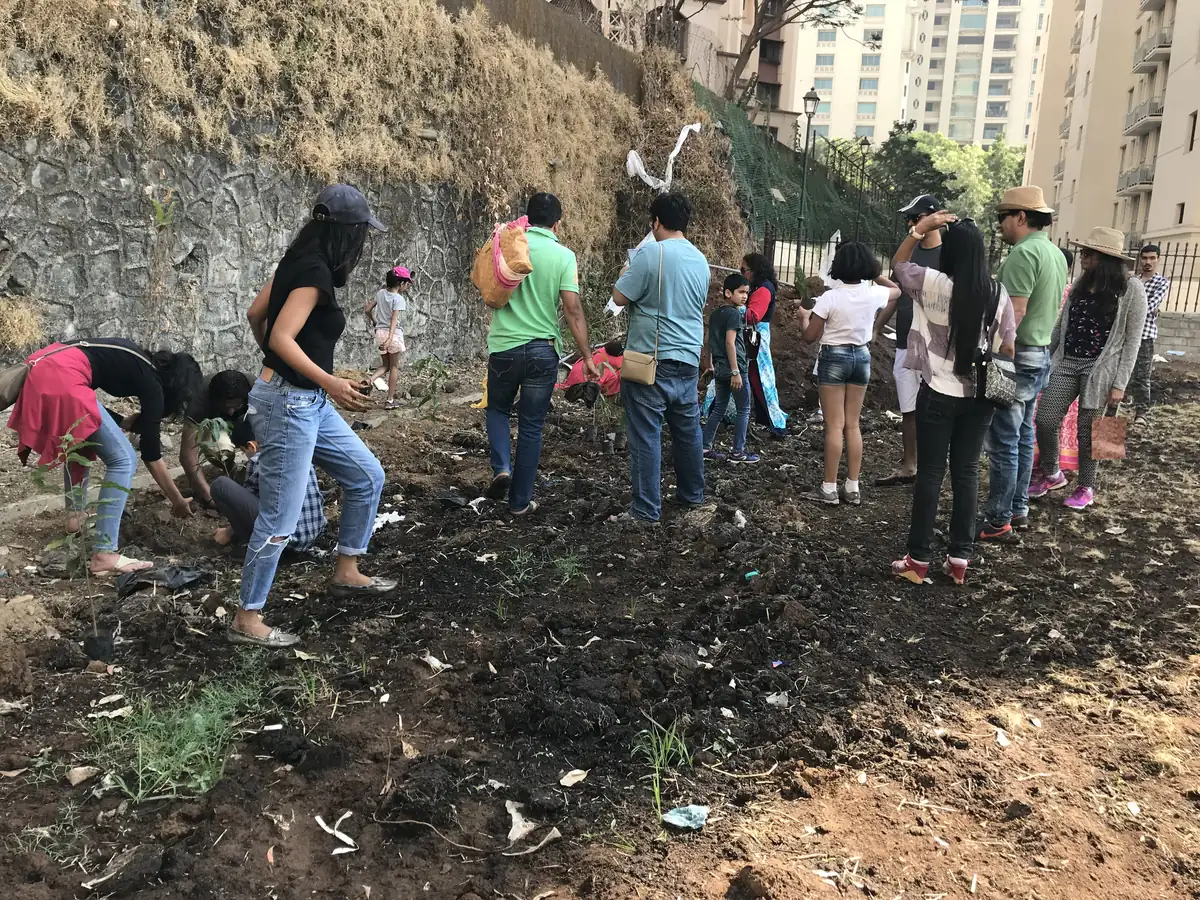
The agriculture programme in section 09 reached its 12 lakh farmers through community leaders who live where they train, part of an Earth5R network of 98,073 community leaders in 5,526 locations.[13]
About these figures. All Earth5R figures in this article are programme-reported by Earth5R and have not been independently audited. For the urban water programme, Earth5R reports that savings were checked against utility consumption records for a 35% sample of adopting buildings each year, and estimated for the rest using technology-specific savings factors.[9] The fertiliser figure in the agriculture programme is self-reported by farmers.[13] None of these figures is a measured change in groundwater levels. They show what building-level and farm-level action looks like at scale.
For companies, CSR teams and city agencies, Earth5R offers measured water programmes in the buildings, farms and catchments where their people and suppliers are, with reporting that fits BRSR. See Earth5R’s CSR and ESG projects.
What to do about groundwater depletion before the 2027 monsoon
Companies and CSR teams
Look up the CGWB category of every block where you have a site or a key supplier. Meter groundwater withdrawal and report it in BRSR as its own line.[12] Fund demand-side work, such as water budgets and farmer training, alongside recharge, and pay for the monitoring and maintenance that show whether it worked. Employees can take part through corporate volunteering.
Housing societies, campuses and city agencies
Audit rooftop rainwater harvesting and recharge pits before the rains, since many stop working when they silt up. Reuse treated wastewater for flushing and gardens. Earth5R’s evidence suggests combining methods saves 2.3 times as much as using one.[9]
Students and young people
Groundwater needs people who can read a well, a water bill and a policy. Earth5R’s water resources internship and sustainability courses are a way in, and volunteers can join field programmes through the Earth5R team.
Researchers and policymakers
The national assessment shows categories improving while half of monitored wells fell against their ten-year average.[1] Linking structure data, well data and water budgets at block level, as Atal Bhujal began to do with public well data,[10] would show which recharge works actually recharge.
Frequently asked questions about groundwater depletion in India
- How serious is groundwater depletion in India?
- India extracted 247.22 bcm of groundwater in 2025, 60.63% of what can be extracted sustainably. Nationally that is moderate, but 730 of 6,762 assessment units draw more than they recharge, and half of monitored wells were below their 2014 to 2023 average in 2024.[1]
- Which states have the worst groundwater depletion?
- Punjab (156.36%), Rajasthan (147.11%) and Haryana (136.75%) are the only states drawing more than 100% of their extractable groundwater. Delhi is at 92.10%, in the critical band.[1]
- What causes groundwater depletion in India?
- Mainly irrigation, which takes 87% of extraction. Withdrawal beyond recharge in the north-west, low recharge in the arid west and low-storage hard-rock aquifers in the south are the three main patterns.[1] Warming is expected to increase pumping.[7]
- Is groundwater in India safe to drink?
- Mostly, but not everywhere. In 2024, 71.7% of CGWB samples met BIS limits on every parameter tested. Nitrate was above the limit in 20.71% of samples, fluoride in 8.05% and arsenic in 3.45%.[2] Test a well before relying on it.
- How will the weak 2026 monsoon affect groundwater?
- Rainfall provides about 60% of recharge.[1] The 2026 monsoon brought 87% of normal rain, with the South Peninsula at 76% and East and North East India at 74%,[3] so lower recharge is likely in those regions before the 2027 monsoon.
- What should companies do about groundwater?
- Know the CGWB category of each site’s block, report groundwater withdrawal in BRSR, follow CGWA rules, which bar new large industry in over-exploited blocks, and fund measured recharge and demand-side work in the same catchment.[12][6]
- How can citizens help save groundwater?
- Fix leaks, install low-flow fixtures, harvest rooftop rain into recharge pits, reuse treated wastewater and keep waste out of lakes and drains. In Earth5R’s urban programme, adopting buildings saved an average of 5,800 litres a month.[9]
Related reading on Earth5R
References
- Central Ground Water Board (2025). National Compilation on Dynamic Ground Water Resources of India, 2025. Ministry of Jal Shakti, Department of Water Resources, River Development and Ganga Rejuvenation. cgwb.gov.in
- Central Ground Water Board (2025). Annual Ground Water Quality Report 2025 (pre-monsoon 2024 monitoring, with the uranium survey of 2024). Ministry of Jal Shakti. cgwb.gov.in
- India Meteorological Department (2026). End of season report for the 2026 southwest monsoon and forecast for October to December. Press release, 30 September 2026. imd.gov.in
- UNESCO World Water Assessment Programme for UN-Water (2022). The United Nations World Water Development Report 2022: Groundwater, Making the Invisible Visible. Paris, UNESCO. un.org
- Ministry of Jal Shakti (2026). Lok Sabha Unstarred Question No. 908, answered 23 July 2026, with state-wise annexure of assessment unit categories, 2025. sansad.in
- Ministry of Jal Shakti (2026). Dynamic Groundwater Resources Assessment, 2025. Press Information Bureau, 29 January 2026. pib.gov.in
- Bhattarai, N., Lobell, D. B., Balwinder-Singh, Fishman, R., Kustas, W. P., Pokhrel, Y. and Jain, M. (2023). Warming temperatures exacerbate groundwater depletion rates in India. Science Advances, 9(35), eadi1401. doi.org
- Ministry of Jal Shakti (2025). Findings of Dynamic Groundwater Resources Assessment. Press Information Bureau, 18 December 2025. pib.gov.in
- Earth5R Research (2026). Water Conservation in Urban India, 2015 to 2025. Case study, report reference Earth5R-WC-2025-003. Programme-reported. earth5r.org
- Ministry of Jal Shakti (2026). Implementation and Impact of Atal Bhujal Yojana. Press Information Bureau, 30 July 2026. pib.gov.in
- Press Information Bureau (2026). Water-Smart Farming with Per Drop More Crop: Transforming Indian Agriculture through Water Efficiency. Explainer, 29 August 2026. pib.gov.in
- Securities and Exchange Board of India (2021). Business Responsibility and Sustainability Reporting Format, Annexure I, Principle 6, Essential Indicator 3 and Leadership Indicator 2. sebi.gov.in
- Earth5R (2026). Agriculture CSR and ESG Case Study, 2015 to 2025: 12 Lakh Farmers Trained in Sustainable Farming. Programme-reported. earth5r.org
- Companies Act, 2013, Schedule VII: Activities which may be included by companies in their Corporate Social Responsibility policies, item (iv). ca2013.com
- Gupta, S. (2026). AI and Sustainability: Planetary Limits. EarthJournal, Earth5R. Section on the Earth5R method, Respect, Reduce, Reuse, Recycle, Restore. earth5r.org
- Earth5R. Mithi River Cleaning and Plastic Waste Management Case Study, October 2020 to November 2024. Programme-reported. earth5r.org
- Earth5R (2026). River Cleanup CSR Project in India: the Mithi and Powai programme. Programme-reported. earth5r.org
How to cite this article
Earth5R (2026). Groundwater Depletion in India: 2026 Data, Hotspots, Contamination and the Fixes That Work on the Ground. EarthJournal, Earth5R, 19 October 2026. https://earth5r.org/groundwater-depletion-india/
Figures are taken from the sources cited and were current on 19 October 2026. National groundwater figures are from the 2025 assessment, the latest published. The UN figure for India’s groundwater use is from an earlier dataset and differs slightly from CGWB’s. Earth5R figures are programme-reported and are not measured changes in groundwater levels.