
India had extreme weather on 270 of the first 273 days of 2025. The decade to 2025 was its warmest on record, and half of the heatwave days people lived through were caused by climate change. India has also built 300 GW of clean power and has shown, from Ahmedabad to coastal Odisha, that warnings and planning save lives. Ahead of COP31, here are ten facts on climate change in India, ending with what a decade of Earth5R field work shows about building resilience street by street.
Climate change in India: the evidence at a glance
- The warmest decade on record
- Extreme weather almost every day
- Heat that climate change made
- The working hours heat takes
- A monsoon of dry spells and downpours
- Warmer seas and stronger Arabian Sea storms
- Thirty years of losses, and the lives warnings save
- A small footprint per person
- 300 GW of clean power
- Local plans that save lives
- What Earth5R sees on the ground
- Case studies: rooftops and a river
- The five R’s for a warming India
- What companies and cities can do
- Questions
The UN climate conference COP31 runs from 9 to 20 November 2026 in Antalya, Türkiye.[6] The facts below start with the temperature record and move through rain, seas, health and money to the solutions India already has on the ground. Read it alongside our briefs on air pollution in India and groundwater depletion in India.
01Fact
2016 to 2025 was India’s warmest decade on record, and 10 of the 15 warmest years since 1901 came after 2011
The India Meteorological Department (IMD) keeps a national temperature record that goes back to 1901. Its statement on the climate of 2025 says the year was 0.28°C warmer than the 1991 to 2020 average, the eighth warmest year on record. The warmest was 2024, at 0.65°C above that average. Ten of the 15 warmest years came in 2011 to 2025, and the decade 2016 to 2025 was the warmest ever recorded in India.[2]
India’s warmest years on record
Annual mean land surface air temperature, difference from the 1991 to 2020 average
Source: India Meteorological Department, Statement on the Climate of India during 2025.[2]
Over the full record, India’s average temperature is rising by 0.68°C per 100 years. Daytime highs are warming faster, at 0.89°C per century, than night-time lows, at 0.47°C. Winter 2025, January and February, was the warmest winter India has measured, at 1.17°C above normal.[2]
The Ministry of Earth Sciences assessment attributes the warming since 1950 largely to human activity, and projects a rise of 2.4 to 4.4°C by 2100, depending on how fast the world cuts emissions.[7]
Warming in India is no longer a projection. It is in the national record, measured by IMD across 125 years, and every year of the last decade sits near the top of that record. Planning for heat is now everyday planning, for schools, workplaces and city budgets alike.
02Fact
Extreme weather hit some part of India on 270 of the first 273 days of 2025, up from 241 days in 2022
The Centre for Science and Environment (CSE) and Down To Earth count every heatwave, cold wave, lightning strike, storm, cloudburst, flood and landslide reported across the country. Their Climate India 2025 assessment found extreme weather on 99% of days between January and September 2025. These events claimed 4,064 lives, affected 9.47 million hectares of crops, destroyed 99,533 houses and killed about 58,982 animals.[1]
Days with extreme weather in India
Days with at least one extreme weather event, 1 January to 30 September
Source: CSE and Down To Earth, Climate India 2025 and India 2023 assessments.[1][8]
The trend is clear across four years. In the same nine months of 2023, extreme weather struck on 235 days and took 2,923 lives.[8] In 2024, the worst year until then, it was 255 days and 3,238 deaths. The 2025 death toll was 48% higher than in 2022.[1]
IMD’s own year-end record points the same way. Heavy rainfall, floods, cloudbursts and landslides claimed more than 1,370 lives in 2025, and thunderstorms and lightning more than 1,310.[2]
Extreme weather in India has become a near-daily event somewhere in the country. A disaster plan built around one big flood a year is no longer enough. Preparedness has to run all year.
03Fact
Half of the heatwave days people in India lived through in the last decade would not have happened without climate change
The Lancet Countdown on health and climate change published its tenth annual report in October 2026. Its India data sheet finds that people in India were exposed to an average of 10.6 heatwave days a year between 2016 and 2025. Of these, 5.3, or 50%, were directly attributable to climate change.[3]
Between 2016 and 2025, people in India were exposed to more than 2,600 hours a year in which simply walking briskly outdoors carried a moderate or higher risk of heat stress, over 200 hours more a year than in the 1990s. Hot nights cost each person an estimated 64 hours of sleep a year between 2021 and 2025.[3]
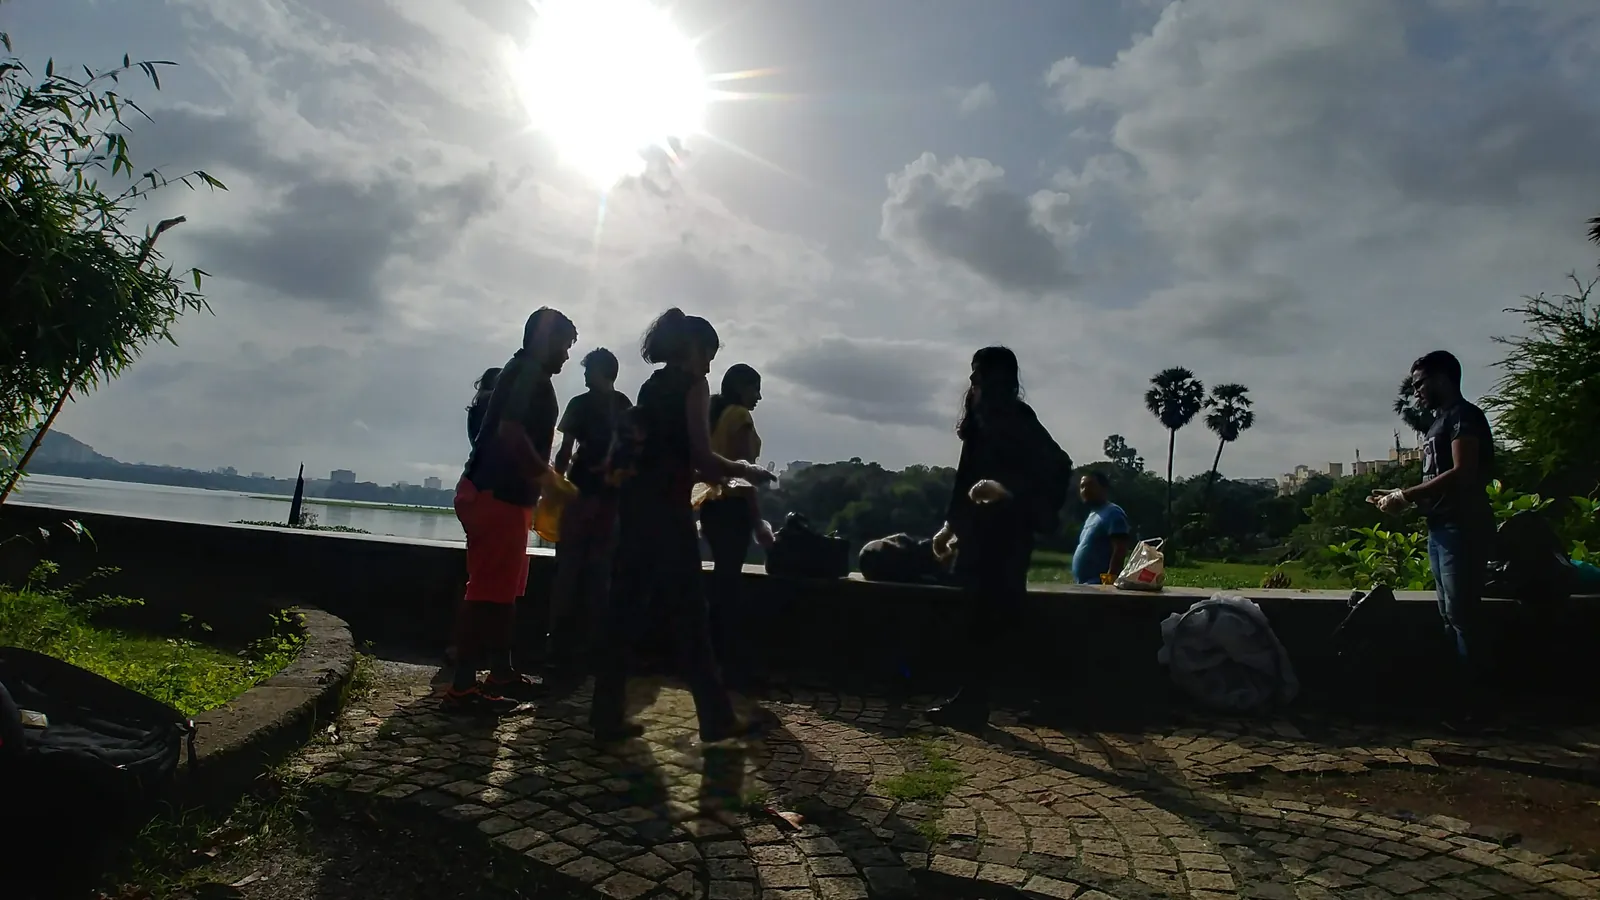
Under a high-emissions path, the Ministry of Earth Sciences projects summer heatwaves to be three to four times as frequent by 2100, and to last about twice as long.[7]
Heat harms the old, the very young, outdoor workers and people in crowded homes first. The answers are local: shade, water points, changed working hours and neighbours who check on each other.
04Fact
Heat cost India 193 billion potential working hours a year, and up to US$174 billion in earnings in 2025
When it is too hot to work safely, work slows or stops. The Lancet Countdown estimates that heat exposure cost India an average of 193 billion potential labour hours a year between 2016 and 2025, 75% more than the yearly average in the 1990s. Hours lost per worker rose by 8.5% over the same period, so much of the increase reflects a larger workforce exposed to heat. Farm work accounts for about 68% of these lost hours.[3]
Who loses working hours to heat
Share of potential labour hours lost to heat in India, yearly average for 2016 to 2025
Source: Lancet Countdown 2026, data sheet for India.[3]
Those lost hours have a price. The same report puts the potential income lost to heat in 2025 at US$174 billion, equal to 4.2% of India’s GDP, with 54% of it falling on agricultural workers.[3]
Heat is an economic issue as much as a health one. Cooler working hours, shade, water and cooler roofs protect both workers and output.
05Fact
The monsoon is arriving as longer dry spells and heavier bursts: very heavy rain days in central India rose by about 75%
A good monsoon total can hide a difficult season. India received 1,274 mm of rain in 2025, 110% of the long period average.[2] Yet CSE recorded extreme weather on all 122 days of the June to September monsoon that year, and 3,007 of the 4,064 deaths it counted for January to September came in those four months. Heavy rain, floods and landslides alone took 2,440 lives.[1]
The longer record explains why. The Ministry of Earth Sciences assessment found that summer monsoon rainfall fell by about 6% between 1951 and 2015. Over the same years the frequency of dry spells rose by 27%, and in central India the number of days with more than 150 mm of rain rose by about 75% between 1950 and 2015. The area of India affected by drought grew by 1.3% per decade from 1951 to 2016.[7] In plain terms, the rain comes in fewer, fiercer bursts, with longer gaps in between.
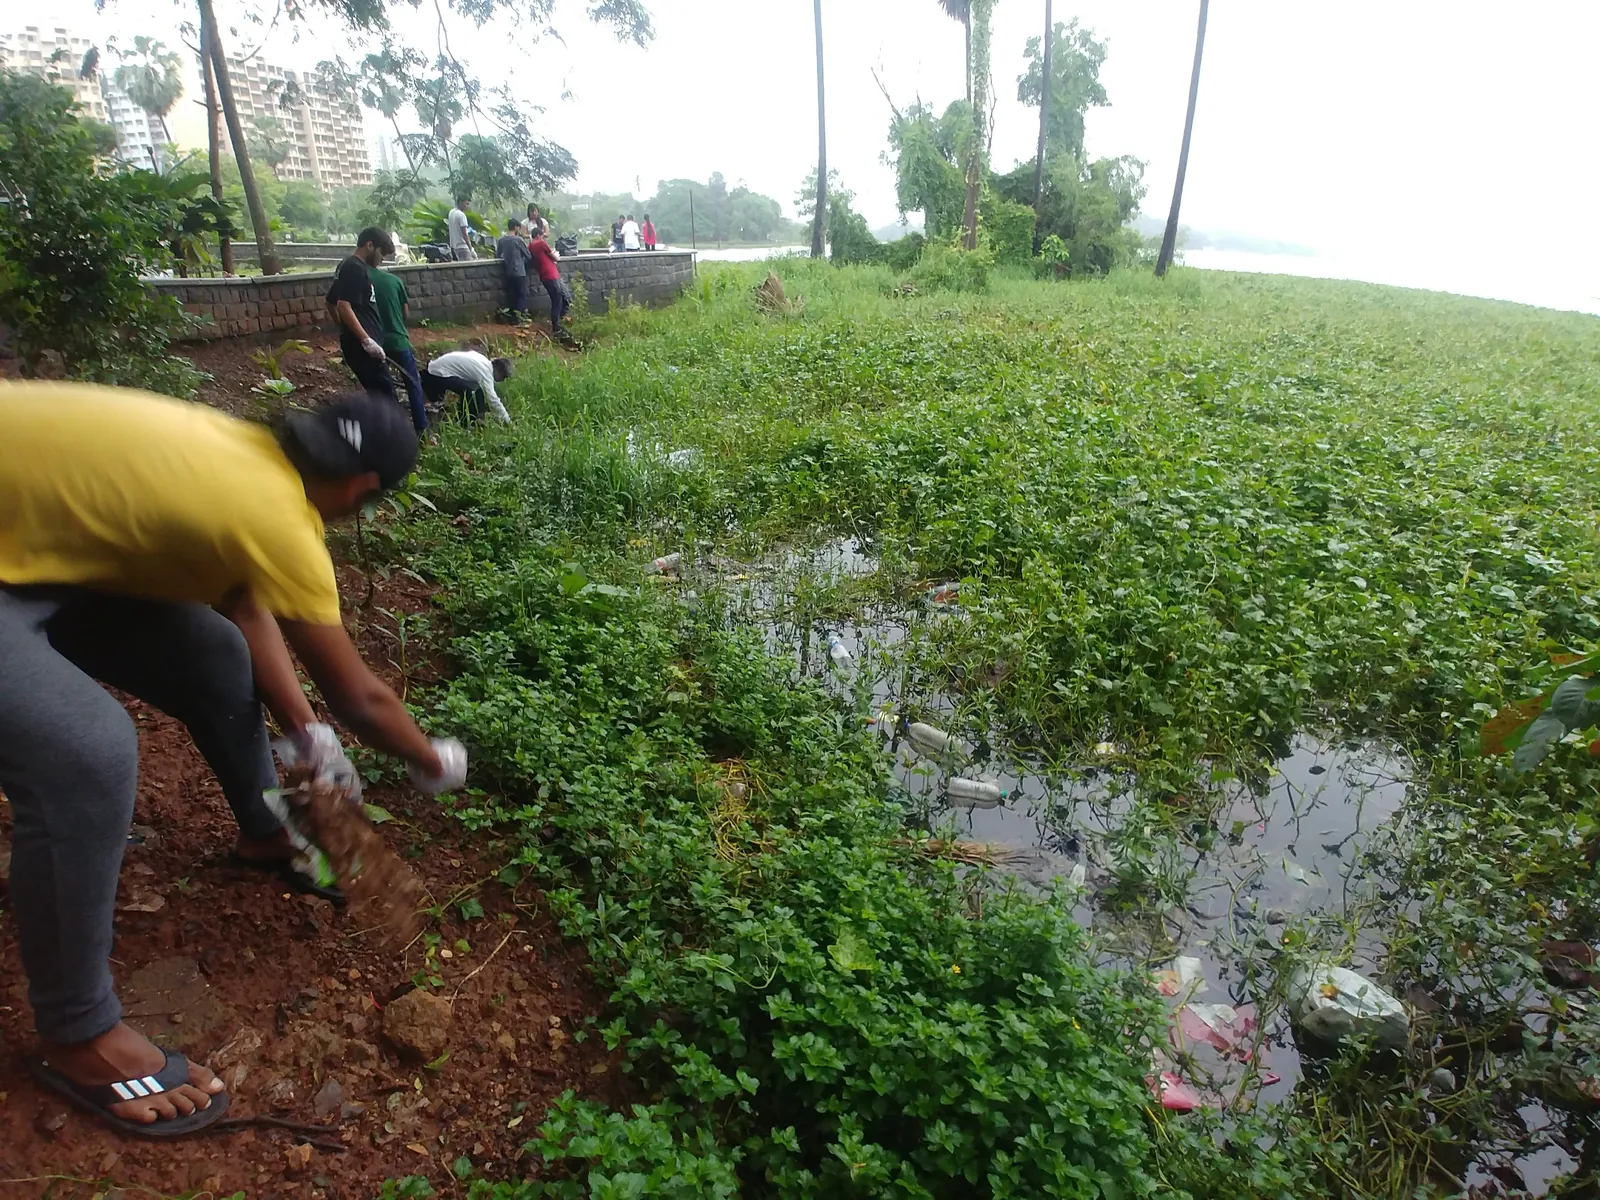
Cities built for steady rain struggle with cloudbursts. Every drain, nala and lake kept clear of plastic and silt is extra capacity on the day it matters.
See Earth5R’s sustainable drainage model for urban flooding and the flood resilience framework for informal settlements.
06Fact
The Indian Ocean warmed by 1°C in 65 years, and Arabian Sea cyclones became 52% more frequent
Sea surface temperature in the tropical Indian Ocean rose by about 1°C between 1951 and 2015, faster than the global average of 0.7°C over the same period. Sea level in the north Indian Ocean rose by 1.06 to 1.75 mm a year between 1874 and 2004, and by 3.3 mm a year between 1993 and 2017.[7]
Warmer water feeds storms. Scientists at the Indian Institute of Tropical Meteorology compared cyclones over the north Indian Ocean in 1982 to 2000 with those in 2001 to 2019. Over the Arabian Sea, the frequency of cyclonic storms rose by 52% and their duration by 80%, and their intensity rose by about 20% before the monsoon and 40% after it. Over the Bay of Bengal, they found no significant change.[9][10] The west coast, from Gujarat and Maharashtra to Karnataka, Kerala and Lakshadweep, is the part of India where cyclone risk is changing fastest.[10]
Mangroves, healthy creeks and free-flowing rivers are coastal defences that reduce the impact of cyclone winds and flooding.{r(“eos”)} Keeping creeks clear of waste supports them.
07Fact
India ranks ninth for climate losses over 30 years, yet early warnings cut cyclone deaths in Odisha from about 10,000 to 44
Germanwatch’s Climate Risk Index 2026 ranks India ninth among the countries most affected by extreme weather from 1995 to 2024. Over those three decades India faced nearly 430 extreme events, with more than 80,000 lives lost, nearly 1.3 billion people affected and close to US$170 billion in economic losses.[11]
The same coast also shows how much can be saved. The 1999 super cyclone in Odisha left about 10,000 people dead. After it, the state built cyclone shelters, installed modern communication systems and set up shelter management committees. When Very Severe Cyclonic Storm Phailin made landfall in October 2013, the state evacuated more than one million people within 36 hours, one of the largest evacuations ever carried out in the country. Phailin affected about 13.2 million people and damaged around 2.57 lakh homes, but 44 lives were lost.[12]
Two cyclones, one coast
Deaths in very severe cyclones that struck Odisha, in thousands
Source: Government of Odisha, World Bank, Asian Development Bank and United Nations, Cyclone Phailin Joint Rapid Damage and Needs Assessment, 2013.[12]
That record has continued. Four cyclonic storms formed over the north Indian Ocean in 2025. Two, Shakti and Senyar, caused no deaths in India. Severe Cyclonic Storm Montha claimed nine lives in Andhra Pradesh and Telangana, and Ditwah two in Tamil Nadu.[2]
Odisha shows that deaths from an extreme event are not fixed by the weather. They depend on warning, shelters and how well communities know what to do.
08Fact
Each person in India emits 2.2 tonnes of fossil CO₂ a year, less than half the world average
India’s fossil carbon dioxide emissions reached about 3,193 million tonnes in 2024, according to the Global Carbon Project. Spread across its population, that is 2.2 tonnes per person, against a world average of 4.73 tonnes.[4] India is home to about a sixth of humanity, yet its emissions per person are among the lowest of any large economy.
Fossil CO₂ emissions per person
Tonnes of CO₂ per person per year, from fossil fuels and cement
Source: Global Carbon Project, Global Carbon Budget 2025, dataset 2025v15.[4]
Per-person emissions have grown as incomes, homes, roads and factories have grown, from 0.67 tonnes in 1990 to 2.2 tonnes in 2024.[4]
India is among the countries most exposed to climate impacts, while its people emit far less per head than the world average. Adaptation matters here as much as cutting emissions.
09Fact
India now has 300 GW of non-fossil power, more than half its capacity, with solar grown from 2.8 GW to 165 GW since 2014
On 31 July 2026, India’s installed non-fossil power capacity reached 300.50 GW, more than 54% of the country’s total of about 552 GW. That is over 60% of the way to the national goal of 500 GW of non-fossil capacity by 2030. A record 55.29 GW was added in 2025-26 alone. Solar capacity has grown from 2.8 GW in 2014 to 164.59 GW, and wind from 21 GW to 58.14 GW.[5]
India’s 300 GW of non-fossil power
Installed capacity by source on 31 July 2026, in gigawatts
Source: Ministry of New and Renewable Energy, Press Information Bureau, 9 August 2026.[5]
Clean power is reaching homes too. Under PM-Surya Ghar, 51.58 lakh households have rooftop solar, with 14.8 GW of capacity, and India now ranks third in the world for renewable energy capacity.[13] Renewable electricity generation has risen from 190.96 billion units in 2014-15 to 477.79 billion units in 2025-26.[5]
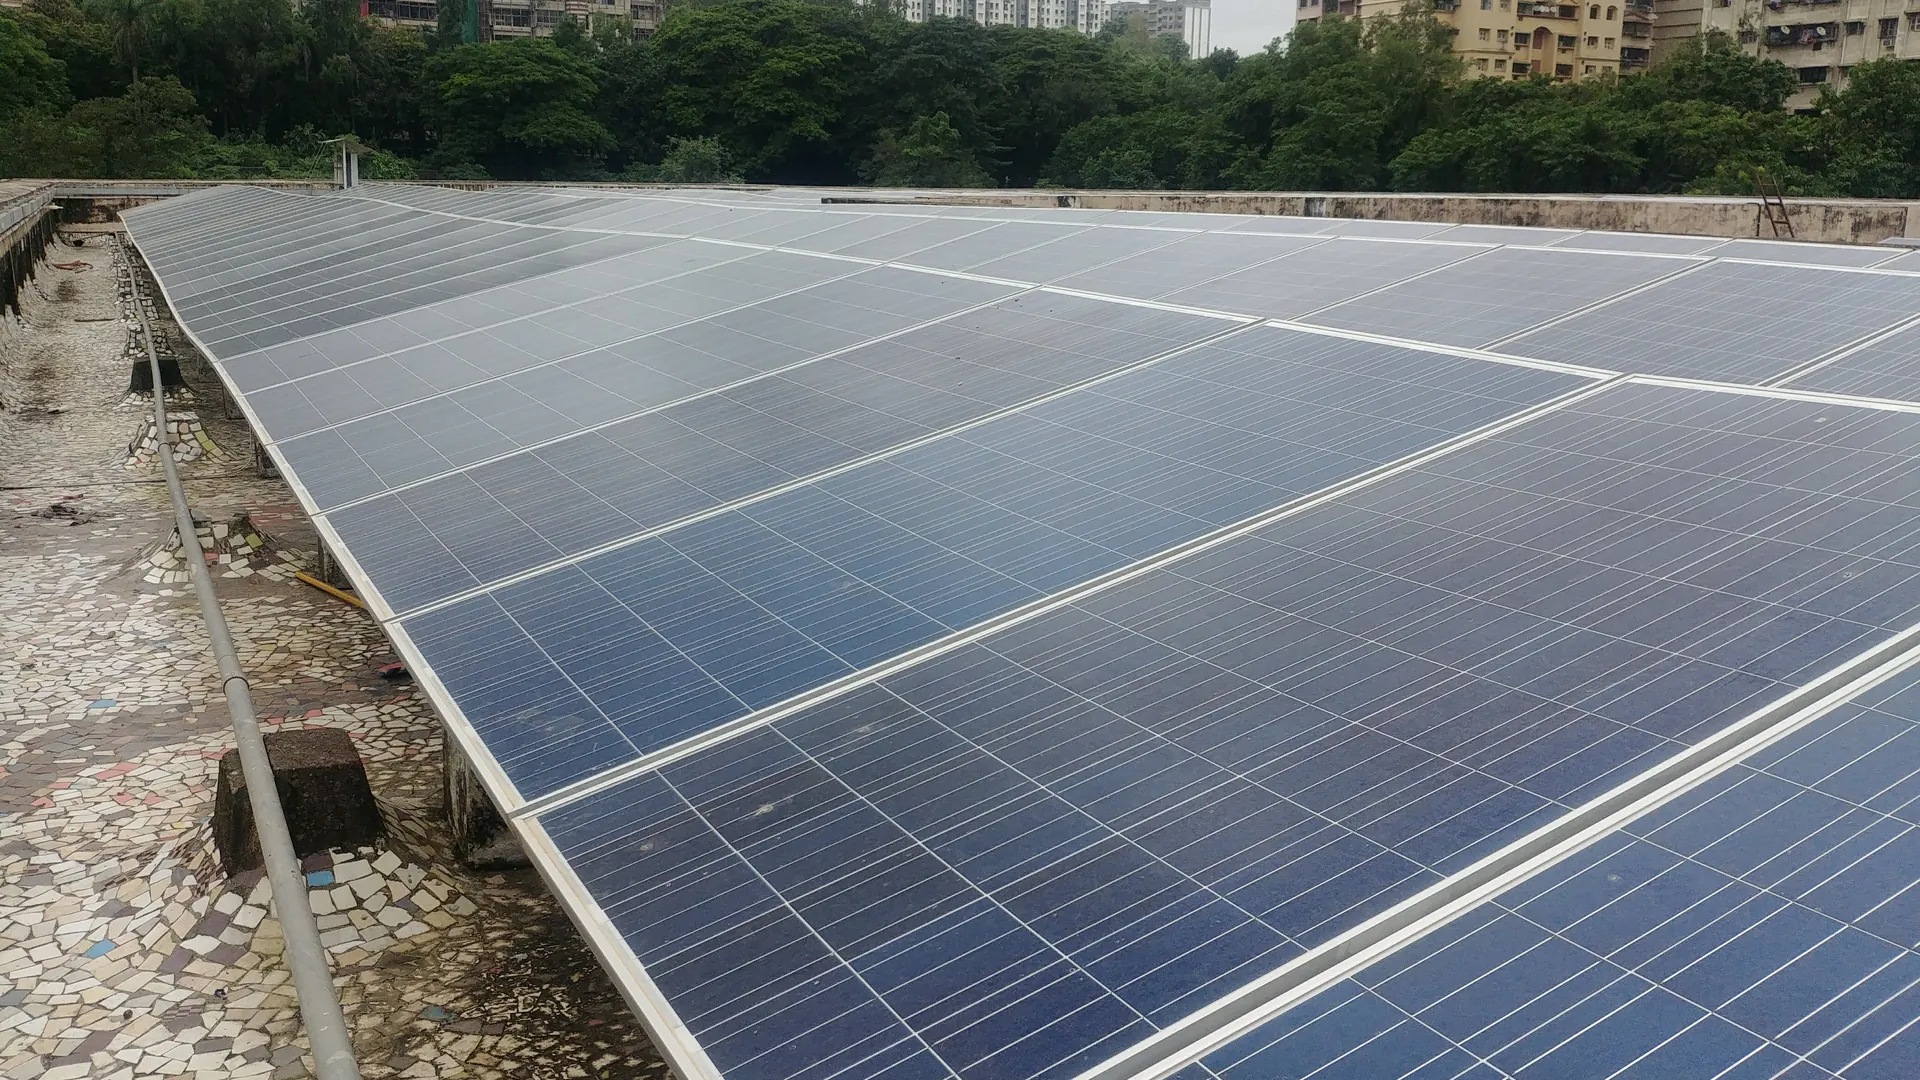
Clean energy also means cleaner air. The Lancet Countdown links fine particle (PM2.5) pollution to more than 2.2 million deaths in India in 2023, and finds that fossil fuels account for 38% of them, with coal behind about two-thirds of that fossil share.[3] Cleaner cooking fuel has made a difference at home: deaths linked to household air pollution fell from about 7.83 lakh in 2016 to 6.17 lakh in 2023.[3] Over a similar period, LPG connections grew from 14.51 crore to 33.18 crore.[13]
Every gigawatt of clean power is a climate gain and a health gain at once. For companies, the fastest wins are on their own roofs and in their supply chains. Our guide to net zero and Scope 3 emissions explains how to count them.
Read Earth5R’s net zero and Scope 3 guide and how solar street lights and lamps reach urban lanes and off-grid tribal homes.
10Fact
Local heat plans save lives: Ahmedabad’s plan was linked to about 1,190 fewer deaths a year
After a deadly heatwave in 2010, the Ahmedabad Municipal Corporation worked with the Public Health Foundation of India, the Indian Institute of Public Health Gandhinagar and international partners to build South Asia’s first heat action plan. It was piloted in 2013 and fully in place in 2014. It combines community outreach, an early warning system with yellow, orange and red alerts, and training for health workers.[14]
A pilot evaluation compared deaths in the hot summers of 2014 and 2015 with 2007 to 2010. It estimated that about 1,190 deaths a year were avoided after the plan began, with the largest declines on the hottest days.[14] The authors are careful: the range around that estimate is wide, from 162 to 2,218, and when the very hot year of 2010 was removed from the comparison the trend held but was no longer statistically significant. Even so, the study concludes that Ahmedabad’s plan can serve as a guide for other cities.
Climate resilience is built locally. Warnings, cool shelters, drinking water, clear drains and trained neighbours are low-cost, and they save lives.
What a decade of Earth5R field work shows about climate change in India
The ten facts above are national. Earth5R works where they are felt: a choked drain, a hot roof, a river carrying plastic and a classroom of young people. Three patterns stand out from our field records.
Flooding starts in the drain
Most urban flooding in a cloudburst begins at a blocked drain. Earth5R volunteers clear plastic and silt from drain edges before and during the monsoon, and train residents to segregate waste so less of it reaches the drain in the first place. Under the Earth5R Climate Training Framework, young people from ages 10 to 24 use the Earth5R app to report blocked drains, illegal dumping and open burning in their area, so the information reaches people who can act on it.[15]
Consistency beats intensity
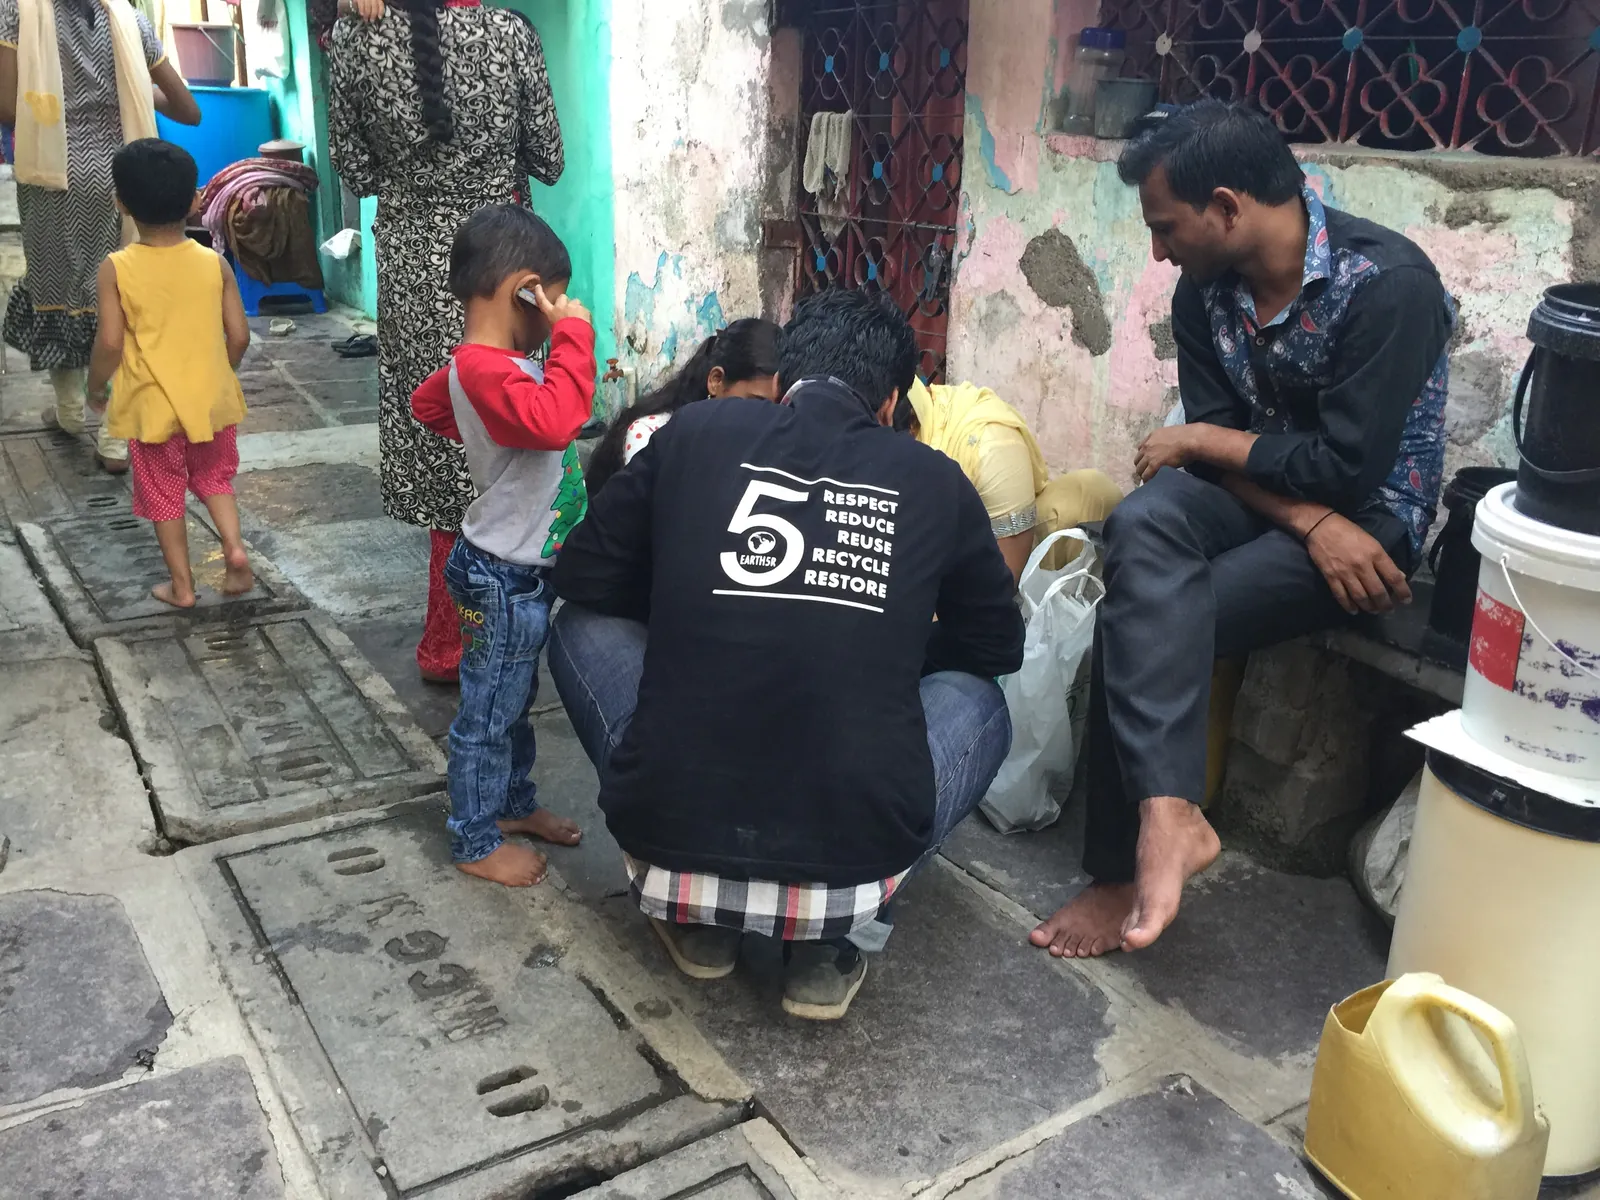
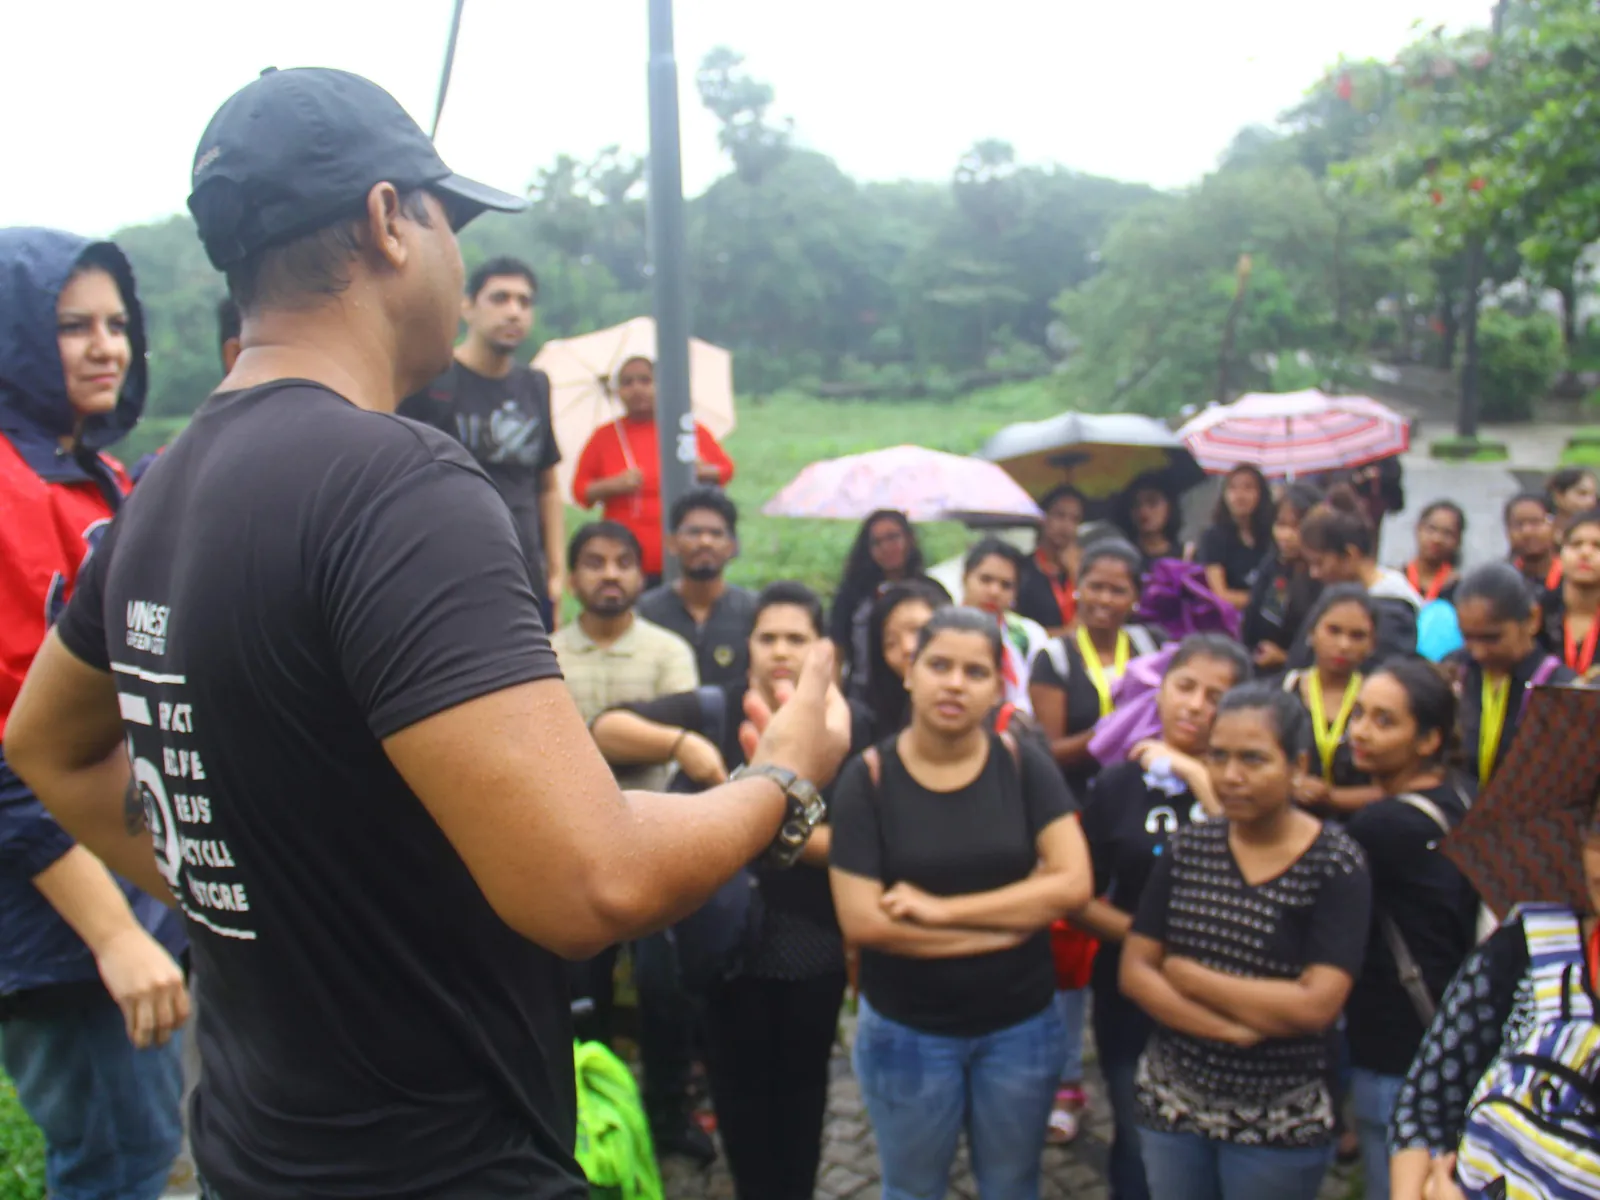
At Powai Lake, Earth5R volunteers ran a cleanup every Sunday for 208 consecutive weeks, whatever the weather, with an average of 70 people each week sorting what they collected into plastics, metals, glass, electronic and medical waste. That persistence, rather than any single large drive, is what produced the recorded 35% reduction in dumping around the site.[16]
People lead the work
Earth5R volunteer team leader Sonam Sengar trains Hexaware employees in waste management and river cleanup techniques under the corporate engagement programme.[17] Hexaware’s CSR programme with Earth5R installed 50 solar street lights in an urban area of Mumbai that lacked safe lighting, and for every street light it also gave a solar lamp to a tribal family in an off-grid rural area.[18]
See Earth5R’s CSR and ESG projects and the climate-ready community model.
Case studies: cooler rooftops and a cleaner river
Rooftop nurseries that cool homes and pay women
Earth5R’s horticulture livelihood and urban greening programme, run with a leading construction partner from January 2015 to December 2025, trains families in slum communities, mainly women, to grow saplings on their rooftops. Over the decade the programme reports 1.10 million saplings produced, ₹12.2 crore in income for slum women and 3,670 participating families. Rooftop greening brought an average reduction of 1.27°C in rooftop surface temperature, measured as a weighted average across those families.[19]
Mithi River: 11,100 tonnes out of the water
From October 2020 to November 2024, Earth5R ran a river plastic recovery programme on Mumbai’s Mithi River with UN Technology Innovation Labs. A solar-powered unit in the water intercepted floating debris, and on the bank the material was segregated, washed, dried and shredded for recycling. The programme removed 11,100 tonnes of waste, including 4,440 tonnes of plastic, trained 10,000 families and 500 businesses, and engaged 15,000 volunteers.[20] Residents were paid for segregated plastic, which gave waste a price instead of a path to the river.
Recycling the recovered plastic is estimated to have avoided about 6,660 tonnes of CO₂e, using a factor of 1.5 tonnes avoided per tonne recycled. This is reported as estimated avoided emissions. No carbon credits were issued or claimed by any party.[20]
Read the Mithi River case study and how river cleanup CSR projects work in the field.
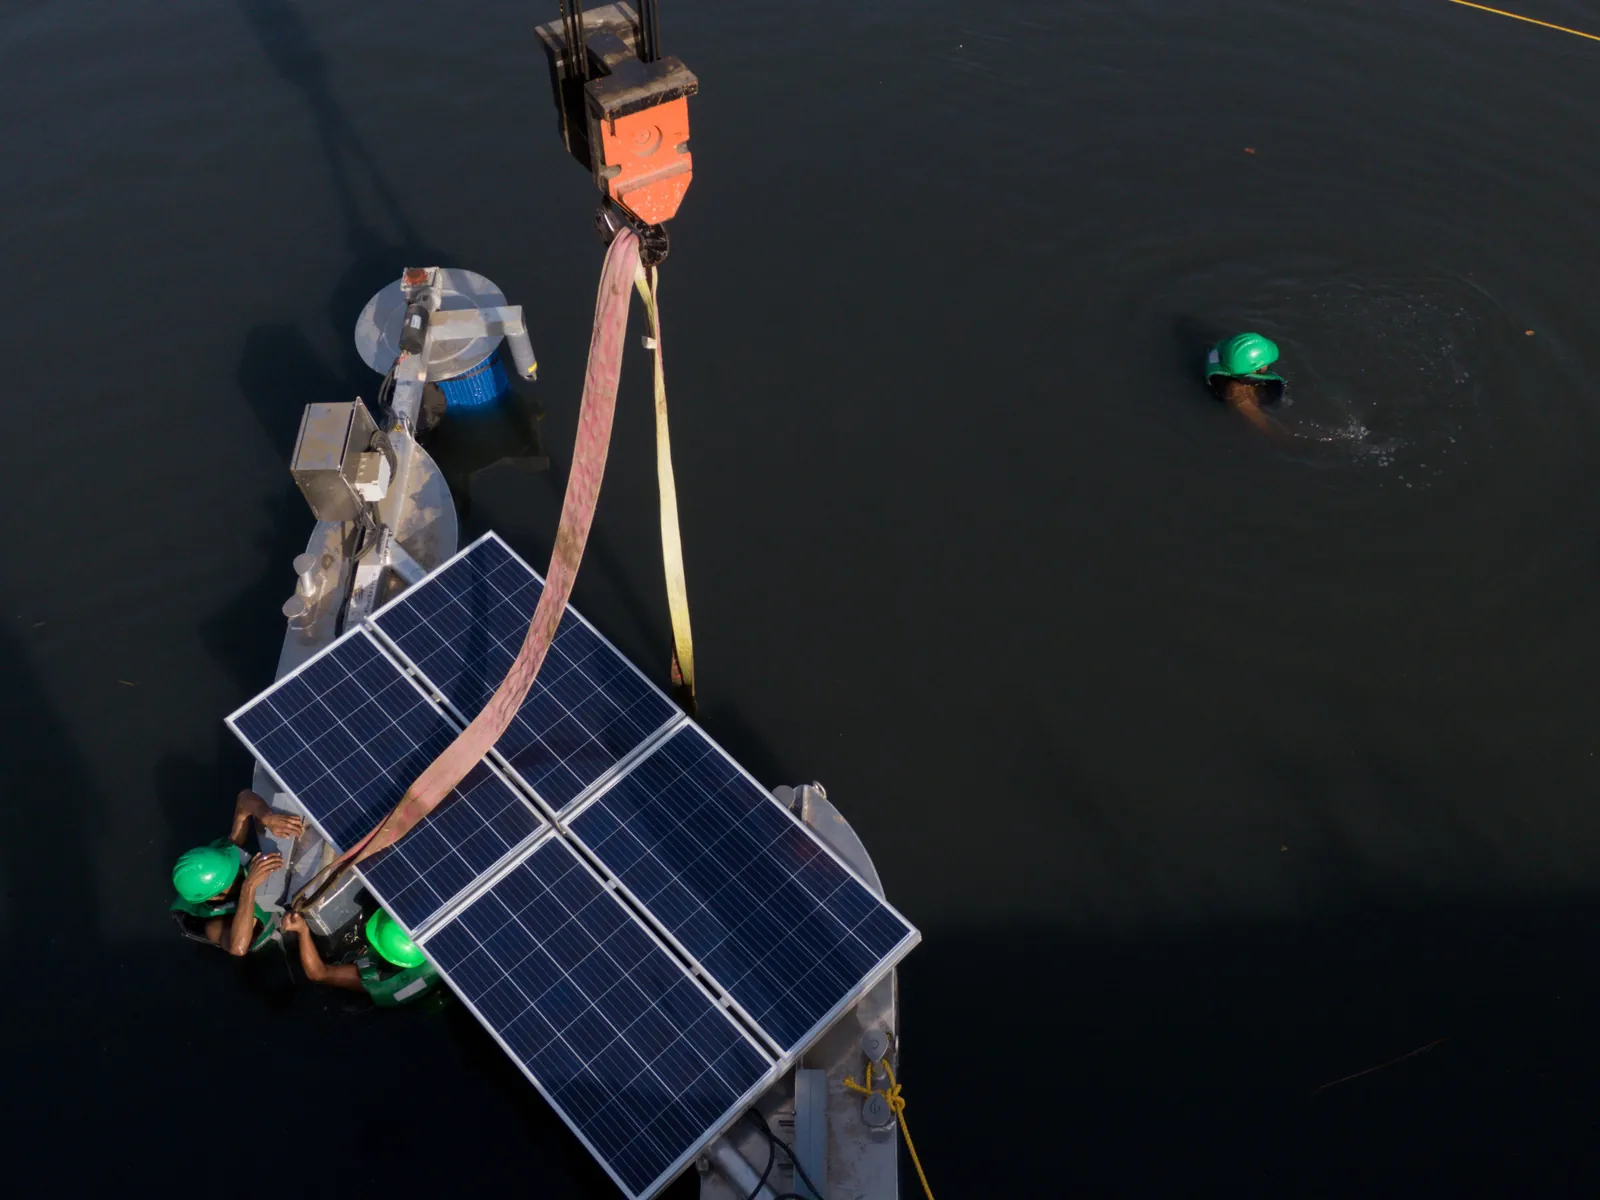
Programme figures in this section are reported by Earth5R from its own field records and case studies, linked above. They cover specific sites, partners and periods, and are not national estimates. The avoided-emissions figure for the Mithi River is an estimate against a stated factor and is not a carbon credit.
The five R’s for a warming India start with Respect for the limits of heat, water and land
In the words of founder Saurabh Gupta, “The 5R in Earth5R comes from a sequence we have taught since 2014: Respect, Reduce, Reuse, Recycle, Restore. The order matters. Respect comes first, respect for nature, for communities and for the limits of growth. A programme that starts at Recycle has skipped the three most important steps.”[21] Climate change shows why the order matters.
| R | What it means for climate change | Evidence and Earth5R work |
|---|---|---|
| Respect | Respect the limits of the human body in heat and of cities in a cloudburst. Plan work, school and travel around them. | Half of recent heatwave days are attributable to climate change.[3] Young people learn to read local risks through the Earth5R Climate Training Framework.[15] |
| Reduce | Cut fossil energy use and waste at source: efficient cooling, clean power, less single-use plastic. | India’s 300.50 GW of non-fossil capacity and 51.58 lakh rooftop solar homes show the shift at scale.[5][13] Hexaware’s solar lights replace grid and kerosene lighting.[18] |
| Reuse | Give materials a second life so fewer new ones are made and less waste blocks drains. | The rooftop nursery programme reports 8.51 lakh upcycled containers used to grow saplings.[19] |
| Recycle | Keep waste segregated and clean so recyclers can use it, and pay the people who collect it. | On the Mithi River, 4,440 tonnes of plastic were recovered for recycling, with an estimated 6,660 tonnes of CO₂e avoided.[20] |
| Restore | Restore the natural defences that absorb heat and water: trees, rooftop greens, lakes, creeks and mangroves. | Rooftop greening cut rooftop surface temperature by an average of 1.27°C.[19] Mangroves blunt cyclone winds and flooding.[10] |
Clean power and recycling matter, but they come after Respect, Reduce and Reuse. Restore rebuilds the green and blue spaces that cool cities and hold water.
What companies, housing societies and cities can do about climate change in India
Practical steps, each linked to the evidence above.
- Write a heat plan for your own people. Shift outdoor work to cooler hours, provide shade, water and rest, and use IMD alerts as triggers, as Ahmedabad’s plan does at 41°C.[14]
- Clear drains before the monsoon, not during it. With extreme weather on every monsoon day of 2025, drain and nala maintenance is year-round work.[1]
- Cool roofs and green them. Rooftop greening cut rooftop surface temperatures by 1.27°C on average in Earth5R’s programme, and it creates income.[19]
- Put solar on your roof and in your supply chain. India’s clean power growth makes this the most direct way to cut Scope 2 emissions.[5]
- Train people to act on warnings. Odisha’s record shows that warnings save lives when communities know what to do with them.[12]
- Report honestly. In BRSR and ESG disclosures, report avoided emissions as estimates with a stated factor, separate from any credits, as the Mithi River case study does.[20]
Our BRSR Core guide explains what listed companies disclose, and our tree plantation brief covers another climate link. Employees and residents can join climate drives through the Earth5R app.
Talk to Earth5R about a climate resilience programmeSee Earth5R’s CSR and ESG projects
Frequently asked questions about climate change in India
- How much has India warmed?
- India’s average temperature has risen by about 0.68°C per 100 years since 1901, according to IMD. The decade 2016 to 2025 was the warmest on record, and 2024 was the warmest single year, at 0.65°C above the 1991 to 2020 average.[2]
- How often does India face extreme weather now?
- CSE and Down To Earth recorded extreme weather somewhere in India on 270 of the 273 days from January to September 2025, with 4,064 lives lost. In the same months of 2022 it was 241 days.[1]
- How is climate change affecting the monsoon in India?
- Rain is coming in fewer, heavier bursts with longer dry spells. Between 1951 and 2015, dry spells became 27% more frequent, and days with over 150 mm of rain in central India rose by about 75%.[7]
- What is the effect of heat on health and work in India?
- The Lancet Countdown finds that half of heatwave days in 2016 to 2025 were attributable to climate change. Heat cost an average of 193 billion potential labour hours a year and about US$174 billion in potential earnings in 2025.[3]
- What is India doing about climate change?
- India reached 300.50 GW of non-fossil power capacity on 31 July 2026, more than half its total, and 51.58 lakh households have rooftop solar under PM-Surya Ghar. Early warning and heat action plans, such as Odisha’s cyclone preparedness and Ahmedabad’s heat plan, have saved lives.[5][13][12][14]
- What is Earth5R doing about climate change?
- Earth5R trains young people aged 10 to 24 through its Climate Training Framework, clears drains and rivers with volunteers, and runs programmes such as rooftop nurseries, which cut rooftop surface temperature by 1.27°C on average, and the Mithi River recovery, which removed 11,100 tonnes of waste.[15][19][20]
Related reading on Earth5R
References
- Centre for Science and Environment and Down To Earth (2025). India experienced extreme weather events on 99 per cent of the days in the first nine months of 2025: Climate India 2025. Press release, New Delhi, 19 November 2025. cseindia.org
- India Meteorological Department (2026). Statement on the Climate of India during 2025. IMD, Ministry of Earth Sciences, January 2026. mausam.imd.gov.in
- Lancet Countdown on Health and Climate Change (2026). India Data Sheet 2026, drawing on Romanello, M., Walawender, M., Israelsson, J. et al. The 2026 report of the Lancet Countdown on health and climate change. The Lancet, October 2026. lancetcountdown.org and doi.org/10.1016/S0140-6736(26)01779-4
- Global Carbon Project (2025). Fossil CO₂ emissions by country, dataset version 2025v15 (Global Carbon Budget 2025), India and world series, via Open Climate Data. openclimatedata.net
- Ministry of New and Renewable Energy (2026). India achieves landmark 300 GW non-fossil fuel power capacity. Press Information Bureau, 9 August 2026. pib.gov.in
- United Nations (2026). COP31 to take place 9 to 20 November 2026 in Antalya, Türkiye. un.org
- Krishnan, R., Sanjay, J., Gnanaseelan, C., Mujumdar, M., Kulkarni, A. and Chakraborty, S. (eds) (2020). Assessment of Climate Change over the Indian Region: A Report of the Ministry of Earth Sciences (MoES), Government of India. Springer, Singapore. Executive summary. doi.org/10.1007/978-981-15-4327-2
- Centre for Science and Environment and Down To Earth (2023). Pre-COP28 media briefing: A disaster a day. Press release on India 2023: An assessment of extreme weather events, New Delhi, 29 November 2023. cseindia.org
- Deshpande, M., Singh, V. K., Ganadhi, M. K., Roxy, M. K., Emmanuel, R. and Kumar, U. (2021). Changing status of tropical cyclones over the north Indian Ocean. Climate Dynamics 57: 3545 to 3567. doi.org/10.1007/s00382-021-05880-z
- Pardikar, R. (2021). Climate change is making India’s west coast more vulnerable to cyclones. Eos 102, 13 September 2021. doi.org/10.1029/2021EO163064
- Adil, L., Eckstein, D., Künzel, V. and Schäfer, L. (2025). Climate Risk Index 2026. Germanwatch, Bonn, November 2025. germanwatch.org
- Government of Odisha, Asian Development Bank and World Bank (2013). India: Cyclone Phailin in Odisha, October 2013. Rapid Damage and Needs Assessment Report. documents.worldbank.org
- Press Information Bureau (2026). India’s energy journey: expanding capacity, strengthening security. Factsheet, 13 August 2026. pib.gov.in
- Hess, J. J., Lm, S., Knowlton, K., Saha, S., Dutta, P., Ganguly, P. et al. (2018). Building resilience to climate change: pilot evaluation of the impact of India’s first Heat Action Plan on all-cause mortality. Journal of Environmental and Public Health 2018: 7973519. doi.org/10.1155/2018/7973519
- Earth5R (2025). From awareness to action: Earth5R’s climate change training framework for India. EarthJournal, 20 June 2025. earth5r.org
- Earth5R (2026). River cleanup CSR projects: from funding to field impact. EarthJournal, 12 August 2026, on the Mithi River site. Programme-reported. earth5r.org
- Earth5R (2026). The state of India’s rivers. EarthJournal, 24 February 2026, photograph of volunteer team leader Sonam Sengar training Hexaware employees. earth5r.org
- Earth5R. Hexaware’s solar street light initiative with Earth5R. Case study. earth5r.org
- Earth5R Research Division (2026). Urban Greening and Horticulture Livelihoods in India’s Construction and Real Estate Sector: A Decade of Forensic Evidence (2015 to 2025). Report RE-2025-006. Programme-reported. earth5r.org
- Gupta, S. Mithi River plastic waste cleanup: what 11,100 tonnes actually took. Case study, October 2020 to November 2024. Earth5R. Programme-reported. earth5r.org
- Gupta, S. (2026). AI and Sustainability: Planetary Limits. EarthJournal, Earth5R. Section on the Earth5R method, Respect, Reduce, Reuse, Recycle, Restore. earth5r.org
How to cite this article
Earth5R (2026). Climate Change in India: 10 Facts on Heat, Floods, Monsoon and What Works on the Ground. EarthJournal, Earth5R, 4 November 2026. https://earth5r.org/climate-change-india/
Figures are taken from the sources cited and were current on 4 November 2026. Extreme weather counts from CSE cover January to September of each year. Heat, labour and health figures from the Lancet Countdown are modelled estimates. Indian figures use lakh and crore. Earth5R figures are programme-reported and link to the case studies they come from.