
India generates more e-waste than any country except China and the United States, and its formal recycling has grown faster still, from about one tonne in ten of the official estimate in 2017-18 to seven in ten in 2024-25. The next test is turning old phones, batteries and solar panels into copper, gold and lithium. Here are ten research-backed facts on e-waste in India, ending with what a decade of Earth5R collection drives shows about the hardest step: getting a device into the right hands.
E-waste in India: the evidence at a glance
- Third largest in the world
- The official count and what it covers
- Formal recycling’s fast climb
- Where the recyclers are
- US$91 billion of metals
- Critical minerals from scrap
- The ₹22 a kilo question
- The health cost of informal recycling
- Solar panels, the next wave
- Repair, the cheapest recycling
- What the numbers add up to
- Earth5R on the ground
- Case studies: four cities and Bengaluru
- The five R’s for e-waste
- What companies and cities can do
- Questions
E-waste is any discarded electrical or electronic product, from phones and chargers to fridges, batteries and solar panels. India’s E-Waste (Management) Rules, 2022 have covered 106 categories of such equipment since 1 April 2023.[2] For the collection side in depth, read our companion piece on why collection is India’s real e-waste bottleneck.
01Fact
India is the world’s third-largest generator of e-waste at about 41 lakh tonnes a year, yet each Indian discards just 2.9 kg
The Global E-waste Monitor 2024, from the International Telecommunication Union and the UN Institute for Training and Research, puts the world’s e-waste in 2022 at 62 billion kg, or 7.8 kg per person, up from 34 billion kg in 2010. Only 22.3% of it was documented as formally collected and recycled. E-waste is growing almost five times faster than documented recycling, and the Monitor projects 82 billion kg by 2030.[1]
The largest e-waste generators
E-waste generated in 2022, lakh tonnes
Source: ITU and UNITAR, Global E-waste Monitor 2024, Annex 2 country data. One lakh tonnes is 100 million kg.[1]
India generated 4,137 million kg, about 41 lakh tonnes, in 2022, behind only China and the United States. Per person, though, it is 2.9 kg, well under half the world average.[1] In 2025 alone, about 152 million smartphones were shipped in India.[6]
India’s e-waste is driven by scale and rising ownership, not heavy use per person. Every device sold today is future e-waste, so the system that receives it must keep growing.
02Fact
India’s official e-waste estimate rose 11% in a year to 13.98 lakh tonnes, and it counts only what registered producers sell
The Central Pollution Control Board (CPCB) estimates e-waste generation from the sales data of producers. Under the 2016 rules it covered 21 types of electrical and electronic equipment, and its estimate rose from 7,08,445 tonnes in 2017-18 to 16,01,155 tonnes in 2021-22.[7] Under the E-Waste (Management) Rules, 2022, the estimate is built from producers registered on the CPCB’s Extended Producer Responsibility (EPR) portal across 106 categories. It stood at 12,54,286.55 tonnes in 2023-24 and 13,97,955.59 tonnes in 2024-25.[2]
India’s official e-waste estimate
E-waste generation estimated by CPCB, lakh tonnes
Source: Ministry of Environment, Forest and Climate Change replies in Parliament. The light columns use the earlier 21-product method, the dark columns the 2022 rules. The two series are not directly comparable, and 2022-23 is not reported.[7][2]
The CPCB is open about what the new number leaves out. In its August 2025 report to the National Green Tribunal, it explains that the estimate covers registered producers only, and that e-waste from the unorganised sector, including unbranded and grey-market products, is not captured.[4] That is the main reason the international estimate in Fact 1 is roughly three times the official one. The methods and years differ, but both point to a large share that never passes through a registered brand’s books.
The official estimate is a floor, not a ceiling. It is the e-waste the EPR system already sees, and collection should be designed for the larger amount it does not.
03Fact
Formal processing climbed from 9.8% of the official estimate in 2017-18 to 70.71% in 2024-25
Registered dismantlers and recyclers processed 22,700 tonnes of e-waste in 2016-17. By 2024-25 they processed 9,88,479 tonnes, a more than forty-fold rise in eight years. As a share of the official estimate, formal processing went from 9.8% in 2017-18 to 61.94% in 2023-24 and 70.71% in 2024-25.[3] Parliament replies trace the middle of that climb: 22.07% in 2019-20, 26.31% in 2020-21 and 32.92% in 2021-22.[8]
A fast climb in formal processing
E-waste collected, dismantled and recycled by registered units, share of the CPCB estimate
Source: CPCB data compiled by Factly from Rajya Sabha and RTI replies, and Ministry of Environment, Forest and Climate Change replies in Parliament.[3][8]
The engine is EPR. Since April 2023, producers meet yearly recycling targets by buying certificates from registered recyclers, and e-waste imports for disposal are banned.[2][7] Targets started at 60% of a producer’s past sales in 2023-24, rise to 70% for 2025-26 and 2026-27, and reach 80% from 2027-28.[1][9]
The share is measured against the producer-based estimate, so it shows the EPR system working on the e-waste it sees. Bringing the unseen share in is the shared task for the next decade.
04Fact
India has 381 registered e-waste recyclers, 106 of them in Uttar Pradesh, while 16 states and UTs have none
The CPCB’s August 2025 report to the National Green Tribunal lists 381 registered e-waste recyclers in 102 districts of 19 states and union territories. Five states, Uttar Pradesh, Maharashtra, Karnataka, Haryana and Gujarat, hold 291 of them. Sixteen states and UTs, including Delhi, Goa, Odisha and Jammu and Kashmir, have no registered recycler at all.[4]
Where India’s e-waste recyclers are
Registered e-waste recyclers by state or UT, August 2025, the eight states with the most
Source: CPCB report to the National Green Tribunal, 21 August 2025.[4]
For a household in a state with no recycler, a laptop must travel hundreds of kilometres to reach one, so the neighbourhood scrap trader is often the easiest buyer. The CPCB’s directions to state boards also aim to help informal units move into the formal sector, which is the bridge this geography needs.[4]
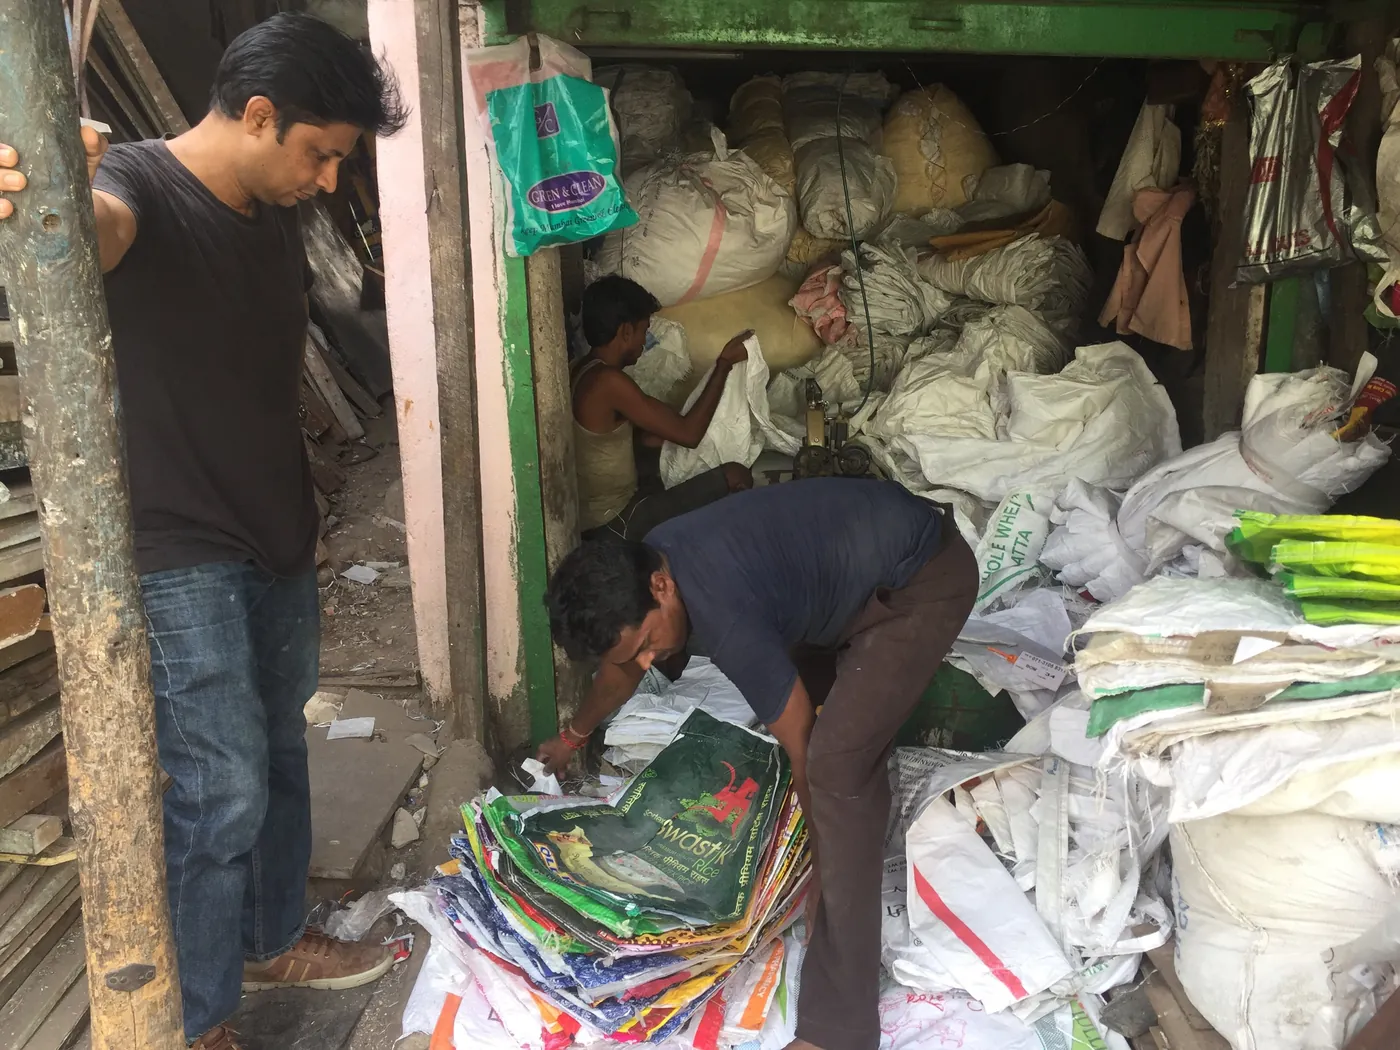
Distance is part of the collection problem. Aggregation centres and partnerships with local scrap traders matter most where no recycler is nearby.
05Fact
The world’s e-waste held US$91 billion of metals in 2022, and only US$28 billion of that value was recovered
Of the 62 billion kg discarded worldwide in 2022, 31 billion kg was metal and 17 billion kg plastic. The Global E-waste Monitor values the metals at US$91 billion, most of it in copper, iron and gold. Across every route, formal and informal, about US$28 billion was viably recovered.[1] Rare earth elements are recycled so little that recycling meets only around 1% of demand.[1]
Metal value in the world’s e-waste
Gross value of metals contained in e-waste in 2022, and the value viably recovered, US$ billion
Source: ITU and UNITAR, Global E-waste Monitor 2024, chapter 9.[1]
In India, most formal recycling still stops before the most valuable step. The Ministry of Mines notes that the 322 registered e-waste recyclers it counted in February 2025 had a reported capacity of about 2.2 million tonnes, but that this recycling presently involves mostly collection, dismantling, shredding or crushing, and sorting, with limited capacity for actually extracting critical minerals.[10] EPR certificates currently cover iron, copper, aluminium and gold.[4]
Every phone handed in at a collection drive carries copper, gold and other metals that India otherwise imports. The money is in refining, which is why the next fact matters.
06Fact
A ₹1,500 crore scheme aims to build 270 kilotonnes of recycling capacity and recover about 40 kilotonnes of critical minerals a year
In September 2025 the Union Cabinet approved an Incentive Scheme for Promotion of Critical Minerals Recycling under the National Critical Mineral Mission. It runs from 2025-26 to 2030-31 with ₹1,500 crore. Eligible feedstock is e-waste, lithium-ion battery scrap and other scrap such as parts of end-of-life vehicles.[5][10]
It offers a 20% capital subsidy for recyclers that start production on time plus an operating incentive, capped at ₹50 crore for large and ₹25 crore for small recyclers, with one third of the outlay set aside for small recyclers and start-ups. The government expects at least 270 kilotonnes of new recycling capacity, about 40 kilotonnes of critical mineral production a year, about ₹8,000 crore of investment and close to 70,000 direct and indirect jobs.[5]
India now treats e-waste as a domestic mine. That works only if feedstock reaches the new plants, which brings the story back to collection.
07Fact
A floor price of ₹22 a kilo for recycling certificates decides whether formal recycling pays, and the question is now before the Delhi High Court
The certificate price is what pays for collection and safe recycling. Amendments notified in September 2024 set minimum prices: ₹22 per kg for consumer electronics and ₹34 per kg for IT and telecom equipment such as phones and laptops.[11][9] The floor is 30% of the environmental compensation for missing a target. Recykal Times reports that the formula includes ₹25 per kg for collection and transport, and that one reverse-auction bid before the floor came in at ₹5.90 per kg.[9]
What a kilo of e-waste is worth on paper
EPR certificate floor prices, cost assumptions and a pre-floor bid, rupees per kg
Source: Mint, 22 April 2025, and Recykal Times, 24 October 2026, citing CPCB environmental compensation guidelines.[11][9]
Several large brands, among them LG, Samsung, Blue Star, Havells, Daikin and Voltas, have challenged the pricing in the Delhi High Court.[11][12] On 24 December 2025, on an application by Blue Star, the court granted an interim stay on a new CPCB portal declaration, introduced on 12 December for transparency, in which buyers and sellers confirm that certificates trade at or above the minimum price. The main case continues.[12][9]
Formal recycling costs more than burning or dumping. A predictable certificate price, at whatever level is settled, lets recyclers invest in collection and safe processing.
08Fact
Only 12% of informal e-waste workers surveyed in Delhi used protective gear, and soil at one recycling cluster held 2,645 mg/kg of lead
Much of India’s e-waste is still dismantled by hand in small workshops. A study published in the Journal of Health and Pollution surveyed 220 informal e-waste workers in Seelampur, Mustafabad and Mandoli in Delhi. Only 24% knew what e-waste meant, 36% knew about the chemicals in it and 12% used personal protective equipment. The median lead level in the workers’ hair was 8 mg/kg, about three times the reference value of 2.4 mg/kg the authors cite for the general population of the United States.[13]
What informal workers knew and used
Share of 220 informal e-waste workers surveyed in three Delhi localities
Source: Singhal, Lyngdoh and Prabhakaran, Journal of Health and Pollution, 2021.[13]
The surroundings carry the same signal. Soil samples from the Mandoli industrial area, where informal recycling was concentrated, showed lead at 2,645 mg/kg, zinc at 777 mg/kg and copper at 116 mg/kg, and nearby groundwater exceeded Indian and WHO limits for some metals.[14] An earlier study at recycling sites in Bengaluru found raised levels of copper, mercury, lead and other elements in soil, air and the hair of workers.[15] The Global E-waste Monitor notes that women in India’s informal sector often do the lowest-paid tasks, such as wire stripping.[1]
The people who dismantle India’s e-waste are part of the solution, not the problem. Training, protective equipment and a route into the formal system, which the CPCB’s directions already encourage, protect their health and keep metals out of soil and water.
09Fact
Solar panels are the next wave: India’s installed capacity could leave 340 kilotonnes of waste by 2030, while about 1,060 tonnes a year is recycled today
India’s solar capacity grew from about 4 GW in March 2015 to 73 GW in December 2023. A CEEW study estimates that this existing capacity will generate about 340 kilotonnes of solar waste by 2030, containing around 10 kilotonnes of silicon, 12 to 18 tonnes of silver and 16 tonnes of cadmium and tellurium. With new capacity added, the total could reach about 600 kilotonnes. Five states, Rajasthan, Gujarat, Karnataka, Andhra Pradesh and Tamil Nadu, are expected to account for most of it.[16]
Solar waste: stored now, recycled later
Solar panel waste in India, storage targets for registered producers and quantities recycled, thousand tonnes
Source: CPCB report to the National Green Tribunal, 21 August 2025.[4]
India brought solar panels into the e-waste rules before the wave arrives. Producers must store waste panels up to 2034-35, with panel life taken as 15 years. By August 2025, 985 producers and 290 recyclers of solar modules had registered. Storage targets for producers were 1,77,741.5 tonnes in 2023-24 and 1,63,809.61 tonnes in 2024-25, while registered recyclers recycled 1,064 and 1,057 tonnes.[4] Worldwide, the Global E-waste Monitor expects solar panel waste to quadruple from 0.6 billion kg in 2022 to 2.4 billion kg in 2030.[1]
Storing panels buys time to build recycling that recovers silicon, silver and glass, not only aluminium frames. That window is the opportunity.
10Fact
Phone and tablet complaints at the National Consumer Helpline rose 20% in two years, and a Repairability Index aims to keep devices working longer
The Department of Consumer Affairs reports that helpline complaints about mobiles and tablets, many about repair, rose from 19,057 in 2022-23 to 21,020 in 2023-24 and 22,864 in 2024-25.[17]
Repair problems are rising
Complaints about mobiles and tablets at the National Consumer Helpline
Source: Department of Consumer Affairs, Press Information Bureau, 3 May 2025.[17]
In May 2025 a committee of the Department submitted a Repairability Index framework for smartphones and tablets. Makers would self-declare a five-point score, built on six parameters including spare parts, repair information and software updates, shown at the point of sale and online.[17]
A phone that lasts longer cuts e-waste at source. Repair scores, spare parts and local repair shops are Reduce and Reuse in practice.
What the numbers add up to: India’s e-waste bottleneck sits at both ends, collection and refining
India’s registered recyclers reported about 22 lakh tonnes of yearly processing capacity in February 2025.[10] In 2024-25 they procured 10.34 lakh tonnes of e-waste and recycled 9.83 lakh tonnes.[4] On paper, the plants could take roughly twice what reaches them. At the other end, the capacity that actually refines critical minerals is about one lakh tonnes, mostly from batteries.[10]
From generation to refined metal
E-waste in India at each stage, lakh tonnes. Dates and methods differ, so read as orders of magnitude.
Sources: Global E-waste Monitor 2024; Ministry of Mines, 2025; CPCB report to the NGT, 2025.[1][10][4]
The middle of the chain, dismantling and shredding, has grown fast and is no longer the main constraint. The first stage, getting a device out of a drawer and into a registered channel, and the last stage, turning shredded boards into copper, gold and lithium, are where the next gains lie. The ₹1,500 crore scheme addresses the last stage directly.[5] The first stage depends on millions of decisions in homes, offices and colleges.
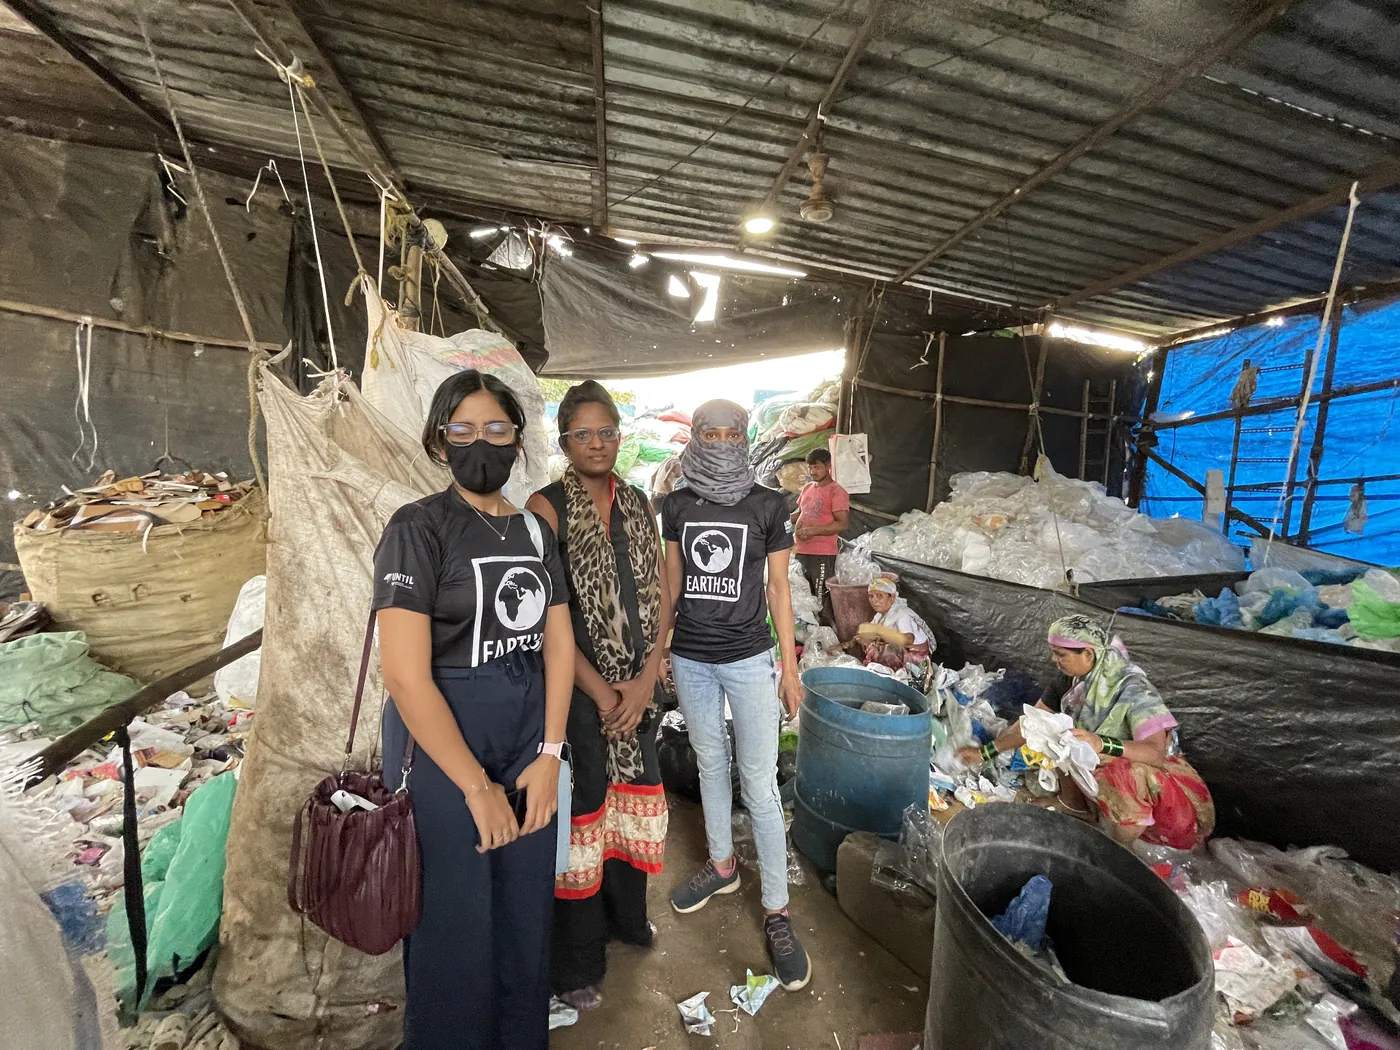
The Solid Waste Management Rules, 2026 help here: material recovery facilities are deposition points for e-waste collected with household waste, giving cities a place to send it.[18]
Recycling capacity has outgrown collection. The highest-value work now is building reliable local routes from homes and offices into the registered system.
Earth5R’s decade of e-waste work: 947.6 tonnes collected across 27 cities, one building, college and lake at a time
Earth5R’s e-waste work began in 2015 with student volunteers in Bengaluru and grew into a national programme with technology companies. Over the decade, Earth5R reports 947.6 tonnes of e-waste collected and sent to authorised recyclers, 8,147 volunteers in 27 cities, 5.08 lakh citizens trained and collection boxes in 4,218 buildings and institutions. Pre and post surveys showed a 72% improvement in e-waste knowledge, and 64% of participants were following proper disposal practice at a six-month follow-up.[19]
Ten years of collection
Cumulative e-waste collected through Earth5R programmes, tonnes
Source: Earth5R Research Division, Electronics and Technology e-waste report, 2015 to 2025. Programme-reported.[19]
These are programme-reported figures from Earth5R records and partner documentation. They have not been independently audited. The report also estimates 2,728.3 tonnes of avoided CO₂ emissions at a factor of 2.88 tonnes per tonne of e-waste and ₹18.7 crore of circular economy value. These are modelled estimates, not carbon credits or audited offsets.[19]
The people who did the work
At St Joseph’s College in Bengaluru, students Ismail, Ayesha, Smriti, Parinitha, Parinisha and Poorvi teamed up with the Seasons Nature Club of the Environmental Science department. They placed four collection boxes around the campus and collected 3 kg of e-waste in six days. The department then kept a permanent e-waste box all year round.[20]
On 14 October 2015, Earth5R volunteer Smriti Tiwari ran a session at Smart Tutorials in Kodichikkanahalli for 15 students from classes 6 to 12 and set up a collection box there.[21] Earlier that year, on 2 September 2015, Kavitha Jain and Sadhna Singh took the message door to door in Shivajinagar.[22] By January 2016 the work had reached Patna.[23]
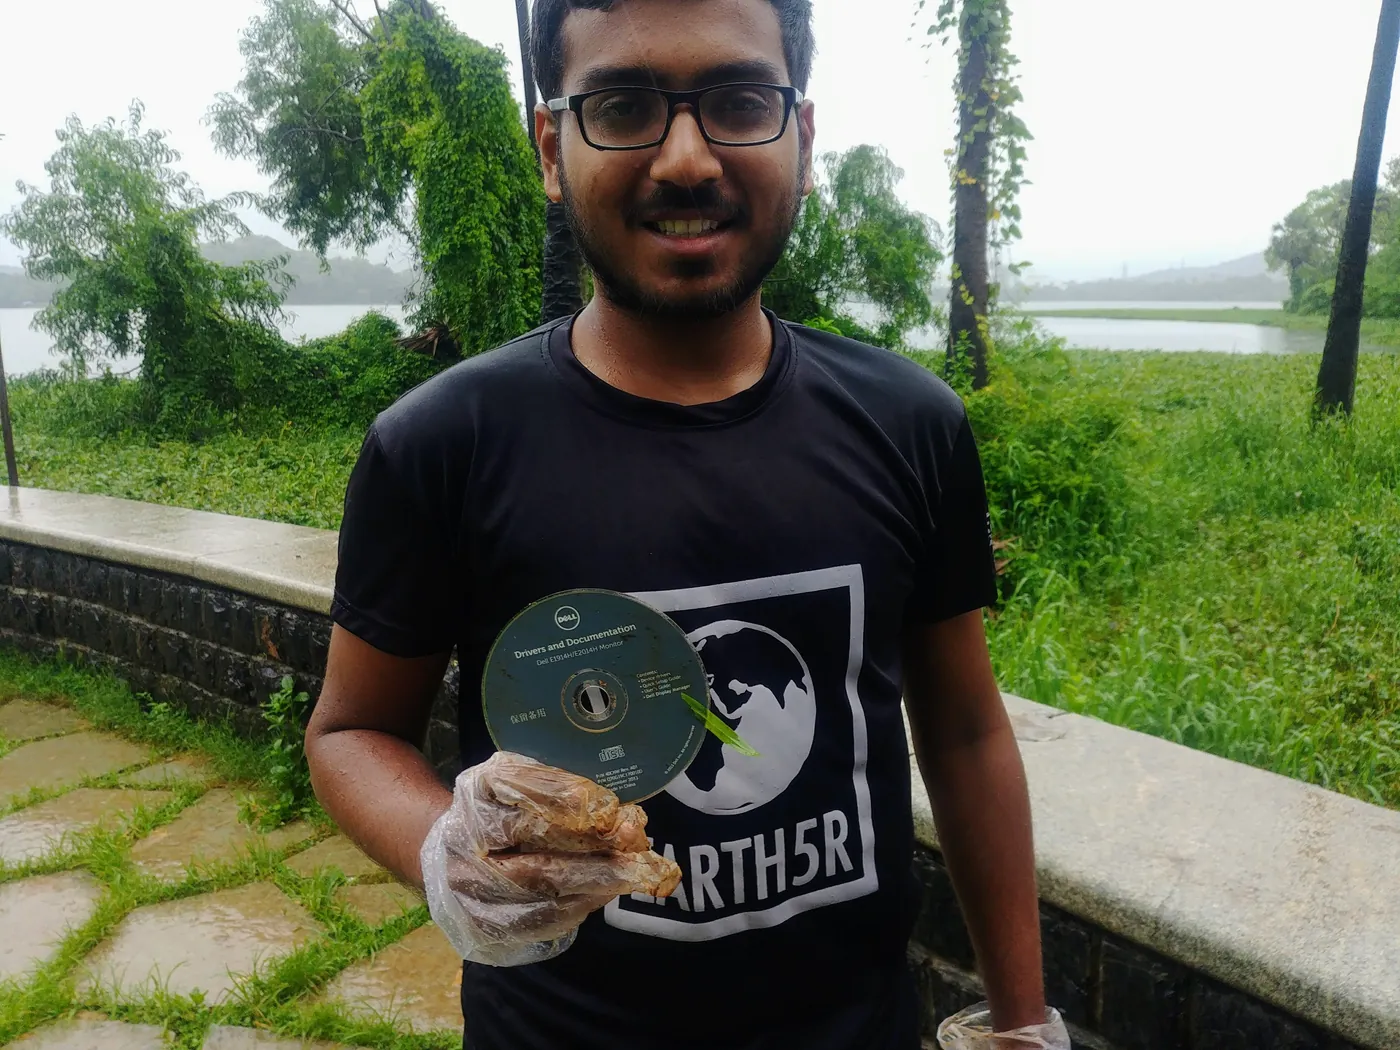
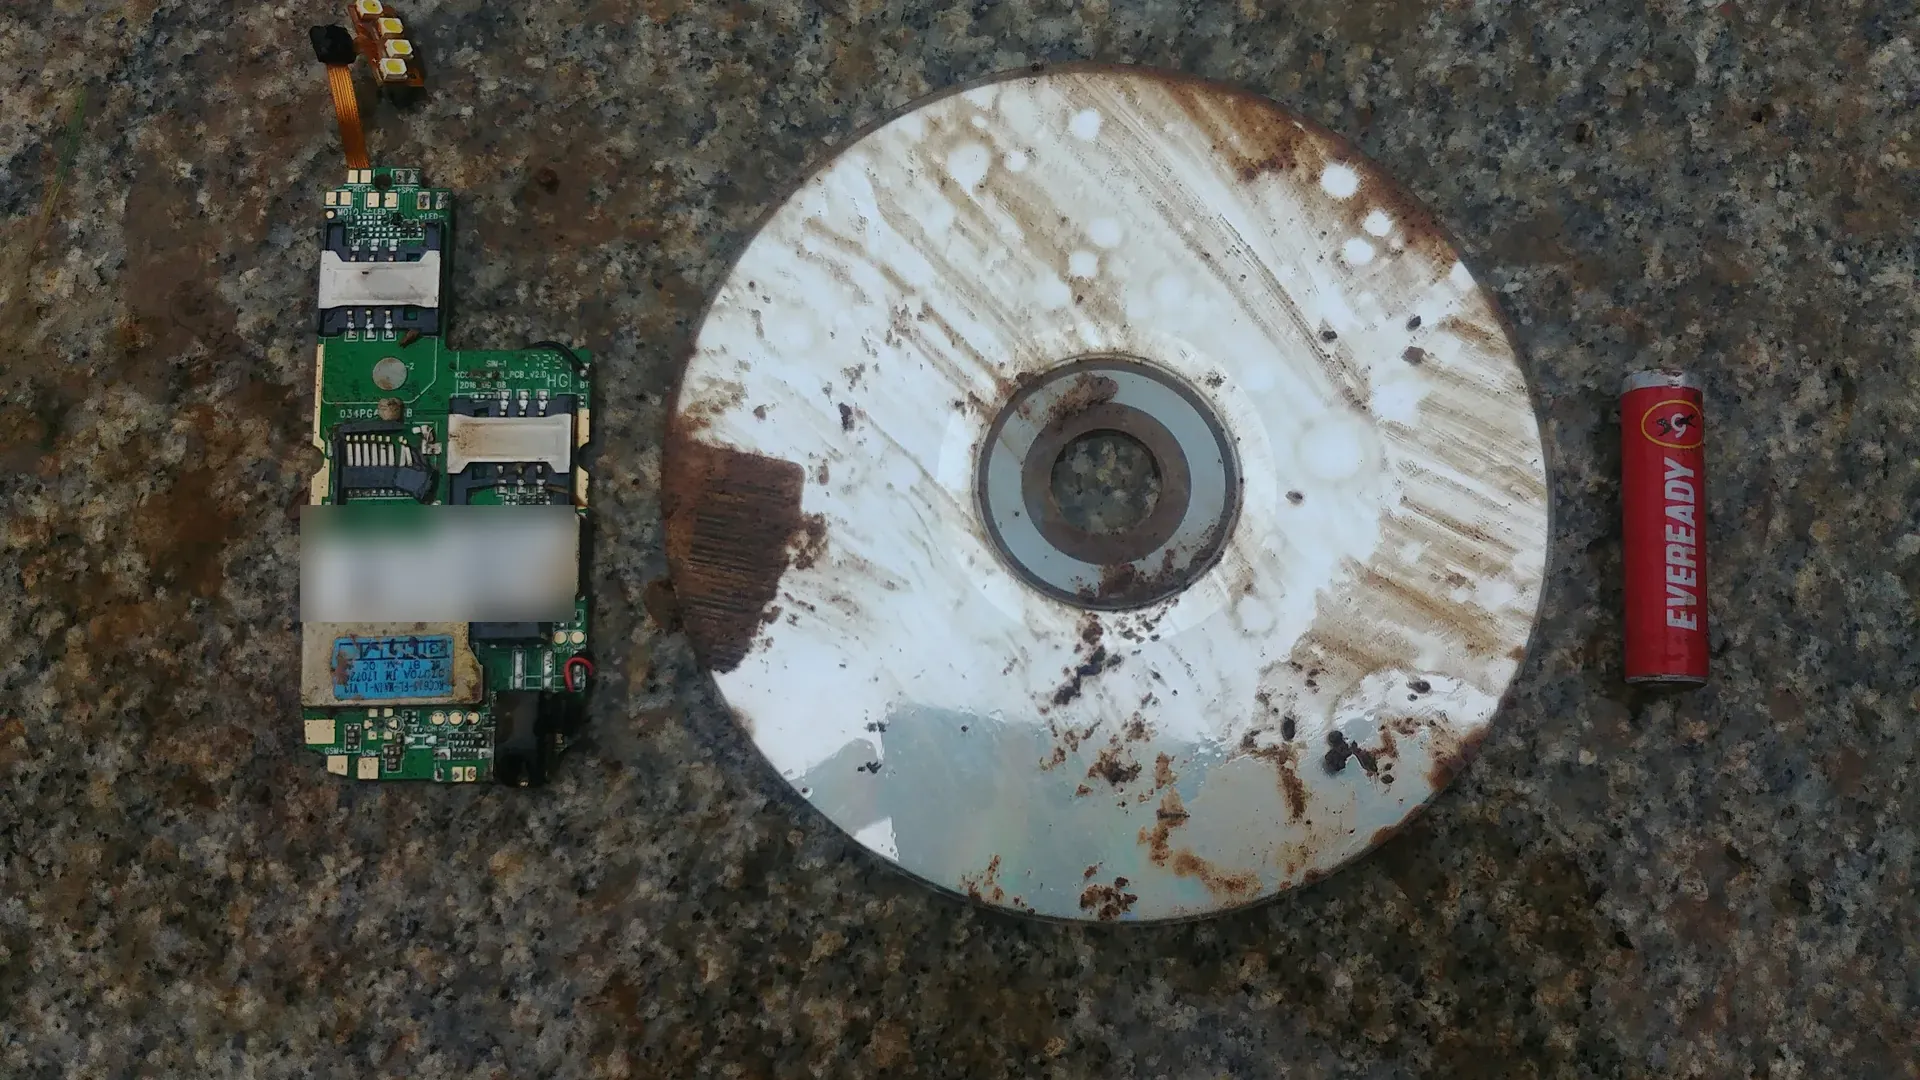
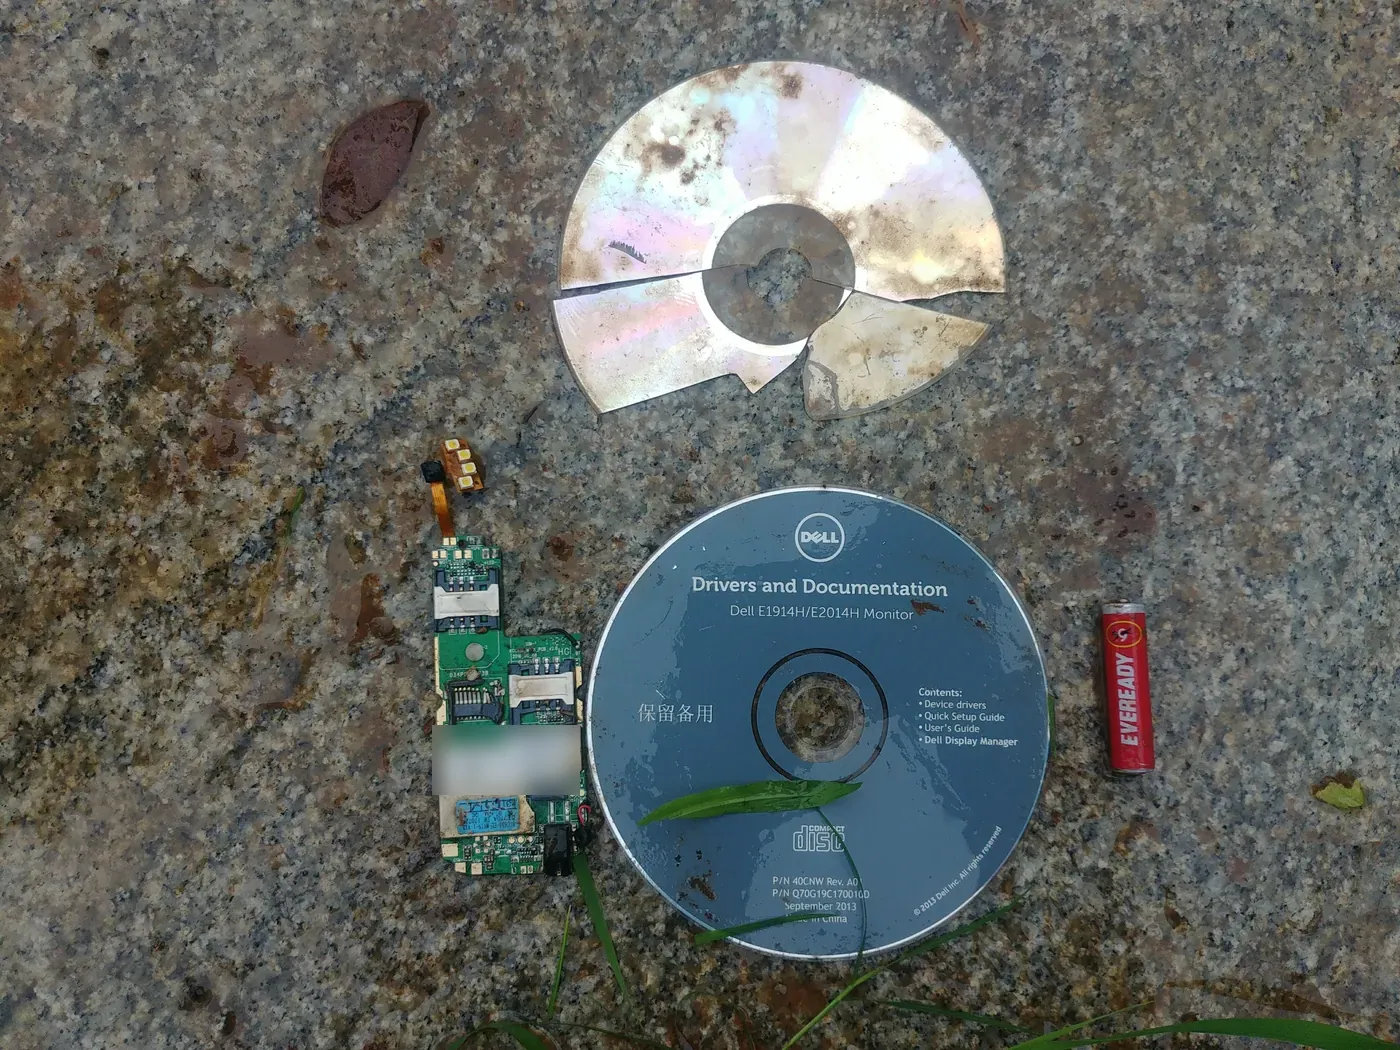
In Mumbai, e-waste turned up where nobody expected it. At the 11th ACT Powai lake cleanup on 7 July 2018, where Saurabh Gupta trained 10 Rotary Club students, the team found circuit boards and CDs on the shore.[24]
Collection is a local habit. A box in a college corridor or society lobby, backed by someone who explains why it matters, moves a phone out of a drawer and into the registered system.
Case studies: a four-city building programme recovered 25 tonnes in a year, and a Bengaluru volunteer drive recovered 72 tonnes in two
Four cities, 200 buildings, one year
With an electronics manufacturer, Earth5R ran a one-year programme across 200 residential buildings in Mumbai, Pune, Delhi and Bengaluru. Residents attended awareness sessions, and each building got a collection box for phones, laptops and batteries, linked to certified processors. The programme recovered 25 tonnes of e-waste, with an estimated 72 tonnes of CO₂e avoided.[25]
Bengaluru, 150 volunteers, twice a month for two years
The Bengaluru drive took the opposite approach. More than 150 college volunteers ran campaigns twice a month for two years in parks, colleges, residential areas and shopping malls, with boxes in colleges, offices and housing complexes and processing by e-waste management companies. It recorded 72 tonnes of e-waste recovered, 28,800 volunteer hours, more than 10,000 citizens trained and an estimated ₹14.4 lakh in recovered material value at ₹20 per kg.[25]
Programme-reported figures. The CO₂e values are project estimates using different factors, 2.88 tonnes per tonne for the four-city programme and 1.44 for the Bengaluru drive, and are not accredited third-party verifications.[25]
The lesson is frequency and convenience: a box in the building removes the journey, and a regular drive means a channel exists when a household is ready. Read the full comparison in our e-waste collection brief and the decade report in the Electronics and Technology case study.
Channel design matters more than budget. Fixed boxes plus regular drives, linked to registered recyclers, deliver traceable tonnes for EPR and BRSR reporting.
The five R’s for e-waste start with Respect, because a device carries mined metals and someone’s health
In the words of founder Saurabh Gupta, “The 5R in Earth5R comes from a sequence we have taught since 2014: Respect, Reduce, Reuse, Recycle, Restore. The order matters. Respect comes first, respect for nature, for communities and for the limits of growth. A programme that starts at Recycle has skipped the three most important steps.”[26] E-waste shows why.
| R | What it means for e-waste | Evidence and Earth5R work |
|---|---|---|
| Respect | Respect the metals mined to make a device, and the health of the people who take it apart. | US$91 billion of metals sat in the world’s e-waste in 2022.[1] Only 12% of informal workers surveyed in Delhi used protective gear.[13] |
| Reduce | Buy fewer, longer-lasting devices and choose products that can be repaired. | The Repairability Index will show a five-point repair score at the point of sale.[17] |
| Reuse | Repair, refurbish, pass on or donate working devices before recycling them. | Repair complaints rose to 22,864 in 2024-25, a sign of demand for repair.[17] At Powai, Earth5R turned collected bottle caps into benches, each using 25 to 30 kg of plastic.[27] |
| Recycle | Hand e-waste only to registered collectors and recyclers so metals return to industry safely. | Formal processing reached 70.71% of the official estimate in 2024-25.[3] Earth5R programmes report 947.6 tonnes sent for recycling.[19] |
| Restore | Clean up places where e-waste has leaked into soil and water, and keep it out of lakes and drains. | Soils at Mandoli showed high lead levels.[14] Earth5R volunteers removed e-waste from the shore of Powai Lake.[24] |
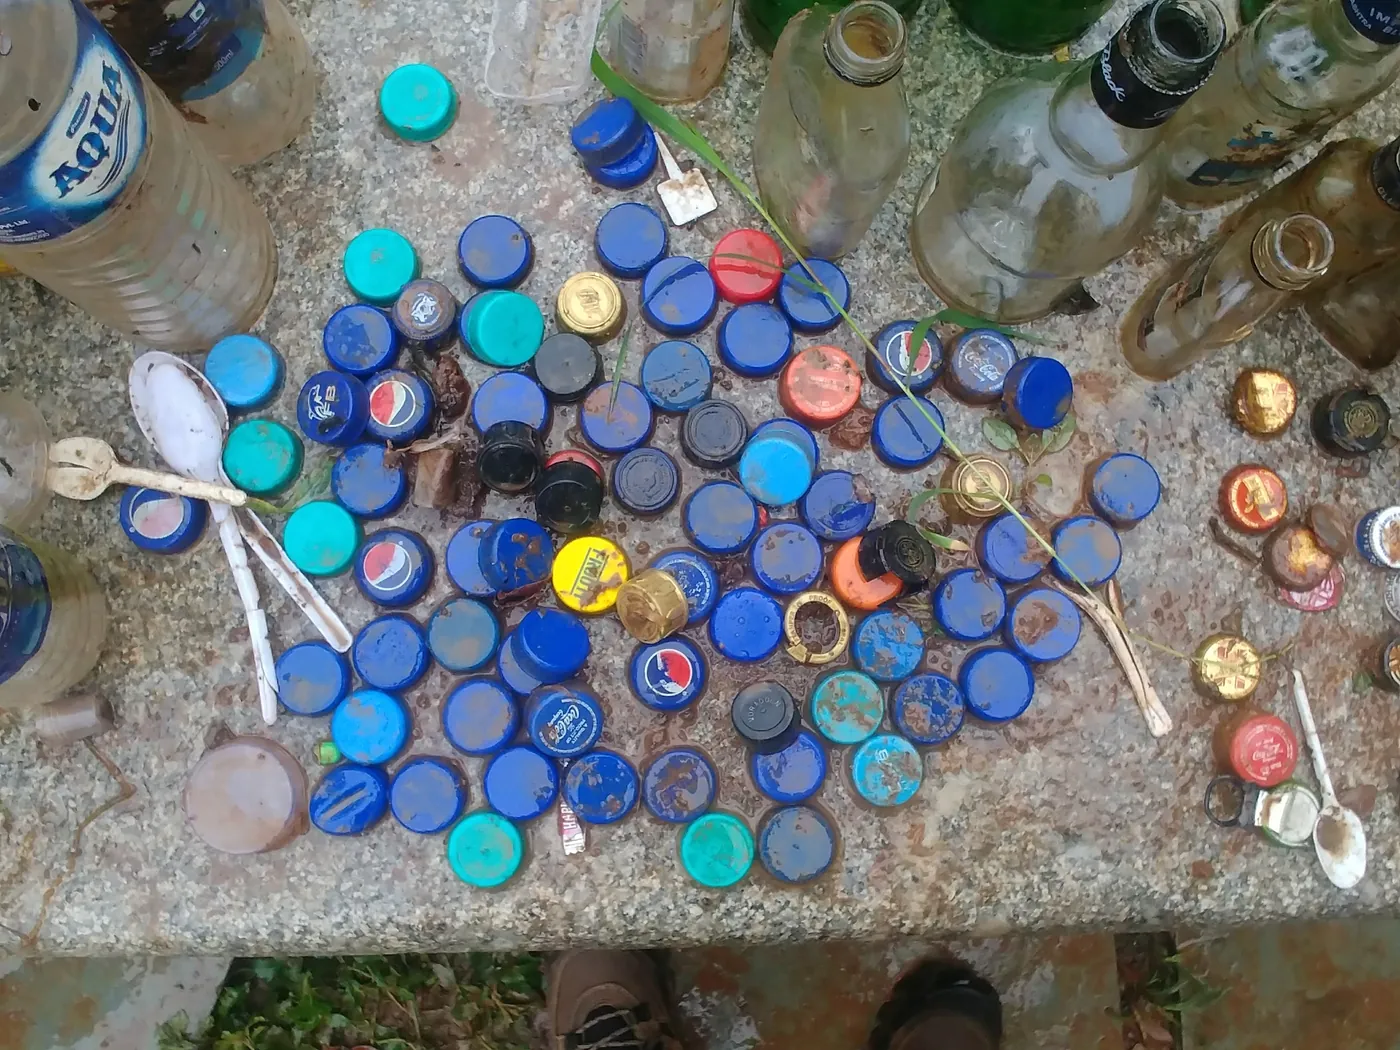
Recycling is the fourth step, not the first. Respect, Reduce and Reuse keep devices in use, and Restore repairs the damage when e-waste escapes.
What companies, housing societies and cities can do about e-waste in India
Practical steps, each linked to the evidence above.
- Treat collection as the core of your EPR plan. Recycler capacity is about twice what reaches the plants, so the gap is in collection.[10][4] Fund boxes in buildings, offices and campuses and regular drives, as in the four-city and Bengaluru programmes.[25]
- Report e-waste properly in BRSR. SEBI’s BRSR Core asks listed companies to disclose e-waste generated under Principle 6, along with how it was recycled or disposed of.[28] Keep weighbridge slips and recycler certificates for every tonne.
- Retire IT assets safely. Wipe data and send devices to registered refurbishers or recyclers.
- Plan for a stable certificate price. Budget EPR at or above the floor prices while the court case continues, so compliance is not at risk whichever way it ends.[9]
- Partner with informal collectors. Training, protective equipment and links to registered recyclers protect workers and bring more e-waste into the formal system.[13][4]
- Use the city’s recovery network. Under the SWM Rules, 2026, material recovery facilities receive e-waste from households, so societies can route it there.[18]
Our BRSR Core guide explains what listed companies disclose, and Earth5R’s ESG and BRSR reporting service helps teams build the evidence trail. Employees and residents can join collection drives through the Earth5R app.
Talk to Earth5R about an e-waste collection programmeSee Earth5R’s CSR and ESG projects
Frequently asked questions about e-waste in India
- How much e-waste does India generate?
- India generated about 41 lakh tonnes of e-waste in 2022, the third highest in the world after China and the United States, according to the Global E-waste Monitor 2024.[1] The CPCB’s official estimate, based on registered producers, was 13.98 lakh tonnes in 2024-25.[2]
- How much of India’s e-waste is recycled?
- Registered units collected, dismantled and recycled 9,88,479 tonnes in 2024-25, or 70.71% of the CPCB estimate, up from 9.8% in 2017-18.[3] The estimate does not include e-waste from the unorganised sector, so the share of all e-waste is lower.[4]
- What are the e-waste rules in India?
- The E-Waste (Management) Rules, 2022, in force since 1 April 2023, cover 106 categories of electrical and electronic equipment. Producers must meet yearly recycling targets through EPR certificates bought from registered recyclers.[2]
- What is the critical mineral recycling scheme?
- A ₹1,500 crore incentive scheme approved in September 2025 for 2025-26 to 2030-31. It supports recyclers that extract critical minerals from e-waste and battery scrap, and is expected to add at least 270 kilotonnes of capacity and about 40 kilotonnes of critical mineral output a year.[5]
- How can I dispose of e-waste safely?
- Give it to a registered collector, a producer take-back scheme or a collection box linked to a registered recycler. Wipe your data first, and never burn or break devices at home. Earth5R runs collection drives with companies, colleges and housing societies.[19]
Related reading on Earth5R
References
- Baldé, C. P., Kuehr, R., Yamamoto, T., McDonald, R., D’Angelo, E., Althaf, S. et al. (2024). The Global E-waste Monitor 2024. International Telecommunication Union (ITU) and United Nations Institute for Training and Research (UNITAR), Geneva and Bonn. Second edition, November 2024, including Annex 2 country data. ewastemonitor.info
- Ministry of Environment, Forest and Climate Change (2025). Electronic waste management. Reply to Lok Sabha Unstarred Question 3592, Press Information Bureau, 11 August 2025. pib.gov.in
- Pavithra, K. M. (2025). India’s e-waste generation doubles in 8 years, but processing remains skewed. Factly, 15 August 2025, compiling CPCB data from Rajya Sabha Unstarred Question 526 (24 July 2025) and an RTI reply. factly.in
- Central Pollution Control Board (2025). Report in compliance of the Hon’ble NGT directions dated 28-05-2025, Execution Application No. 04/2024 in Original Application No. 512/2018 with O.A. No. 1390/2024. Filed before the National Green Tribunal, 21 August 2025. greentribunal.gov.in
- Prime Minister’s Office (2025). Cabinet approves Rs. 1,500 crore Incentive Scheme to promote Critical Mineral Recycling in the country. 3 September 2025. pmindia.gov.in
- Communications Today (2026). India smartphone shipments rise 0.5% in 2025 to 152M units, reporting IDC’s Worldwide Quarterly Mobile Phone Tracker. 17 February 2026. communicationstoday.co.in
- Ministry of Environment, Forest and Climate Change (2023). Generation of e-waste. Reply in Parliament, Press Information Bureau, July 2023, CPCB estimates for 2017-18 to 2021-22. pib.gov.in
- Ministry of Environment, Forest and Climate Change (2023). E-waste generated and collected, dismantled and recycled, 2019-20 to 2021-22. Reply in Parliament, Press Information Bureau, December 2023. pib.gov.in
- Recykal Times Desk (2026). ₹22 a kg is the number that keeps India’s formal e-waste recyclers alive. Recykal Times, 24 October 2026, citing CPCB environmental compensation guidelines under the E-Waste (Management) Rules. recykaltimes.com
- Ministry of Mines (2025). Incentive Scheme for Promotion of Critical Minerals Recycling. Gazette of India notification F. No. 02/12/2024-ES, 8 September 2025. mines.gov.in
- Yadav, K. (2025). Delhi HC orders govt response to LG, Samsung’s e-waste payout challenge. Mint, 22 April 2025. livemint.com
- Rajpurohit, S. (2026). Blue Star gets temporary relief as Delhi HC stays regulator’s e-waste price declaration. Newslaundry, 14 January 2026. newslaundry.com
- Singhal, D., Lyngdoh, T. and Prabhakaran, P. (2021). Knowledge, attitude and practice study of health risks among e-waste recyclers in Delhi. Journal of Health and Pollution 11(29): 210306. doi.org/10.5696/2156-9614-11.29.210306
- Pradhan, J. K. and Kumar, S. (2014). Informal e-waste recycling: environmental risk assessment of heavy metal contamination in Mandoli industrial area, Delhi, India. Environmental Science and Pollution Research 21: 7913 to 7928. doi.org/10.1007/s11356-014-2713-2
- Ha, N. N., Agusa, T., Ramu, K., Tu, N. P. C., Murata, S., Bulbule, K. A. et al. (2009). Contamination by trace elements at e-waste recycling sites in Bangalore, India. Chemosphere 76(1): 9 to 15. doi.org/10.1016/j.chemosphere.2009.02.056
- Council on Energy, Environment and Water (2024). Robust recycling of increasing solar waste critical for India’s energy security. Press release on Enabling a Circular Economy in India’s Solar Industry: Assessing the Solar Waste Quantum, New Delhi, 20 March 2024. ceew.in
- Department of Consumer Affairs (2025). Report for Framework on Repairability Index (RI) in Mobile and Electronic Sector submitted. Press Information Bureau, 3 May 2025. pib.gov.in
- Earth5R (2026). SWM Rules 2026: India’s four-stream waste segregation shift. EarthJournal, 31 March 2026. earth5r.org
- Earth5R Research Division (2026). ESG and CSR for Electronics and Technology: E-Waste Collection and Recycling (2015 to 2025). Report ET-2025-011. Programme-reported. earth5r.org
- Parinitha, P. (2024). E-waste recycling at Bangalore college. EarthJournal, Earth5R, report of the St Joseph’s College drive. earth5r.org
- Tiwari, S. (2024). E-waste awareness for future changemakers at Bangalore, India. EarthJournal, Earth5R, report of the 14 October 2015 session. earth5r.org
- Jain, K. (2024). Creating e-waste awareness in Bangalore. EarthJournal, Earth5R, report of the 2 September 2015 Shivajinagar drive. earth5r.org
- Kashyap, A. and Shriyanshee (2024). E-waste awareness programme. EarthJournal, Earth5R, report of the 17 January 2016 Patna activity. earth5r.org
- Earth5R (2024). E-waste found around Powai Lake. EarthJournal report on the 11th ACT Powai lake cleanup. earth5r.org
- Earth5R (2026). E-waste collection: India’s bottleneck isn’t recycling. EarthJournal, 13 August 2026, sections on the four-city programme and the Bangalore blueprint. Programme-reported. earth5r.org
- Gupta, S. (2026). AI and Sustainability: Planetary Limits. EarthJournal, Earth5R. Section on the Earth5R method, Respect, Reduce, Reuse, Recycle, Restore. earth5r.org
- Earth5R (2024). Creating benches from plastic bottle caps. EarthJournal, report on the ACT Powai cleanups. earth5r.org
- Securities and Exchange Board of India (2023). Format of BRSR Core, Annexure I to the circular on the BRSR Core framework, July 2023, Principle 6, Question 9 of Essential Indicators. sebi.gov.in
How to cite this article
Earth5R (2026). E-Waste in India: 10 Facts on Growth, Recycling, Critical Minerals and What Works on the Ground. EarthJournal, Earth5R, 11 November 2026. https://earth5r.org/e-waste-india/
Figures are taken from the sources cited and were current on 11 November 2026. International and official Indian estimates use different methods and years and are not directly comparable. One lakh tonnes is 100,000 tonnes. Earth5R figures are programme-reported and link to the case studies they come from.