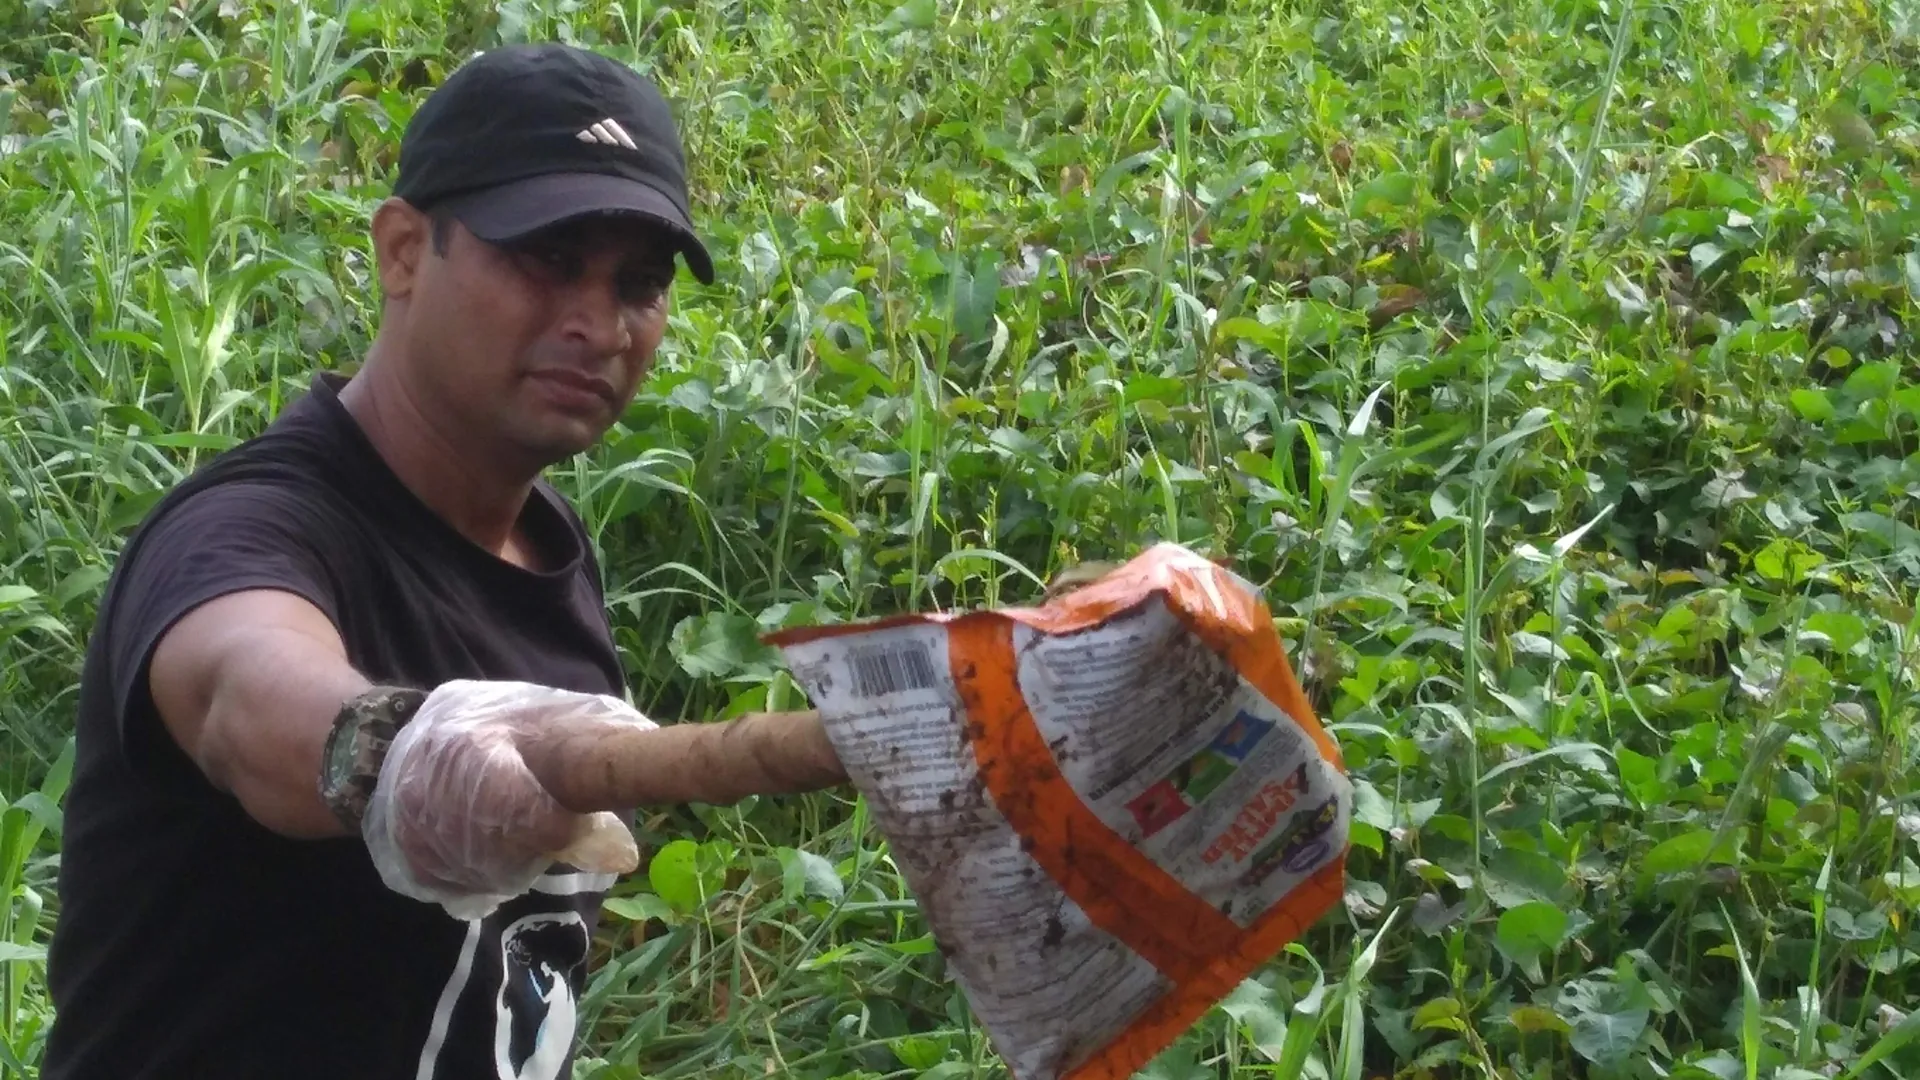
Every salt and sugar sample tested in a 2024 Indian study contained microplastics. A peer-reviewed review published this June estimates that a person in an Indian city may take in around 2,000 plastic particles a day through food, air and water. The Ganga basin carries up to 3 billion particles a day into the Bay of Bengal. This brief sets out what the latest research on microplastics in India shows, where the particles come from, and what a decade of Earth5R cleanups, waste audits and river recovery teaches about stopping plastic before it breaks into pieces too small to catch.
Microplastics in India: the evidence at a glance
- India’s plastic pollution at source
- Plastic waste, counted
- How plastic becomes microplastic
- What rivers carry
- Lakes, mangroves and dump sites
- Salt, sugar and the daily dose
- Microplastics in the air
- The rulebook and the treaty
- What Earth5R pulls from the water
- Case study: the Mithi model
- The five R’s for microplastics
- What companies and cities can do
- Questions
9.3 Mt
India’s microplastic problem starts as large plastic: about 9.3 million tonnes a year escapes collection or is burnt in the open
Microplastics are plastic pieces smaller than 5 mm. A few are made that small, such as the microbeads once common in face scrubs. Most begin as a carry bag, a sachet, a synthetic shirt or a tyre that wears or weathers into fragments. So the first number to understand is how much large plastic reaches the open environment.
The most detailed answer so far is a global inventory published in Nature in 2024 by researchers at the University of Leeds. It estimates that India emits about 9.3 million tonnes of macroplastic pollution a year, within a range of 6.5 to 12.7 million tonnes. That is close to one fifth of the global total of 52.1 million tonnes.[1]
Where the world’s plastic pollution comes from
Estimated macroplastic emissions, million tonnes a year, top four countries, 2020 baseline
Source: Cottom, Cook and Velis, Nature 2024.[1]
The same study shows how this happens. Waste collection already reaches about 81% of India’s population, a large achievement for a country of this size. The remaining 255 million people, about 18% of the population, live where waste is not yet collected, and that gap accounts for 53% of the country’s estimated emissions. The study also estimates that 56.8 million tonnes of municipal solid waste is burnt in the open each year, of which 5.8 million tonnes is plastic.[1]
The global backdrop is growing. The Lancet Countdown on health and plastics reports that world plastic production rose from 2 million tonnes in 1950 to 475 million tonnes in 2022, and could reach about 1,200 million tonnes by 2060. Less than 10% of plastic is recycled.[7]
Every large piece of plastic that is collected whole is thousands of microplastics that never form. The cheapest microplastic control India has is the last mile of waste collection, and it is already 81% of the way there.
41,36,189 t
India’s recorded plastic waste has grown by about a fifth in four years, and the systems to process it are growing alongside
The Central Pollution Control Board (CPCB) compiles plastic waste generation from state reports. Its figures, shared in Parliament in December 2024, rose from 33,60,043 tonnes in 2018-19 to 41,36,189 tonnes in 2022-23.[2]
Plastic waste generated in India
Lakh tonnes a year, CPCB annual reports
Source: Ministry of Environment, Forest and Climate Change, Rajya Sabha reply, Press Information Bureau, 12 December 2024.[2]
Processing capacity has been building at the same time. Under Extended Producer Responsibility (EPR), 2,614 plastic waste processors were registered on the central portal, and about 103 lakh tonnes of plastic packaging waste had been processed through the EPR system. The country had 4,446 material recovery facilities with a combined capacity of 31,427.2 tonnes a day.[2] In rural India, Swachh Bharat Mission (Grameen) provides up to Rs 16 lakh per block for a plastic waste management unit, and 978 such units were operational by early December 2024.[2][8]
India now has the infrastructure skeleton for plastic: EPR registration, a recovery facility network and rural processing units. The work ahead is feeding them clean, segregated plastic every day, which is a job for households, housing societies and businesses as much as for municipalities.
12%
Tyres, road paint, pellets and clothes add a stream of microplastics that never passed through a dustbin
The OECD’s Global Plastics Outlook estimated that 22 million tonnes of plastic leaked into the environment worldwide in 2019. Most of it, 19.4 million tonnes, was large plastic from waste that was not properly collected or disposed of. Microplastics made up 12% of total leakage, and reached the environment mainly through wear of tyres and road markings, accidental loss of plastic pellets and the washing of synthetic textiles.[6]
The OECD also put numbers on what is already in the water. An estimated 109 million tonnes of plastic has accumulated in the world’s rivers, and 30 million tonnes in the ocean. As it waits, it fragments into ever smaller particles that are harder and costlier to remove.[6]
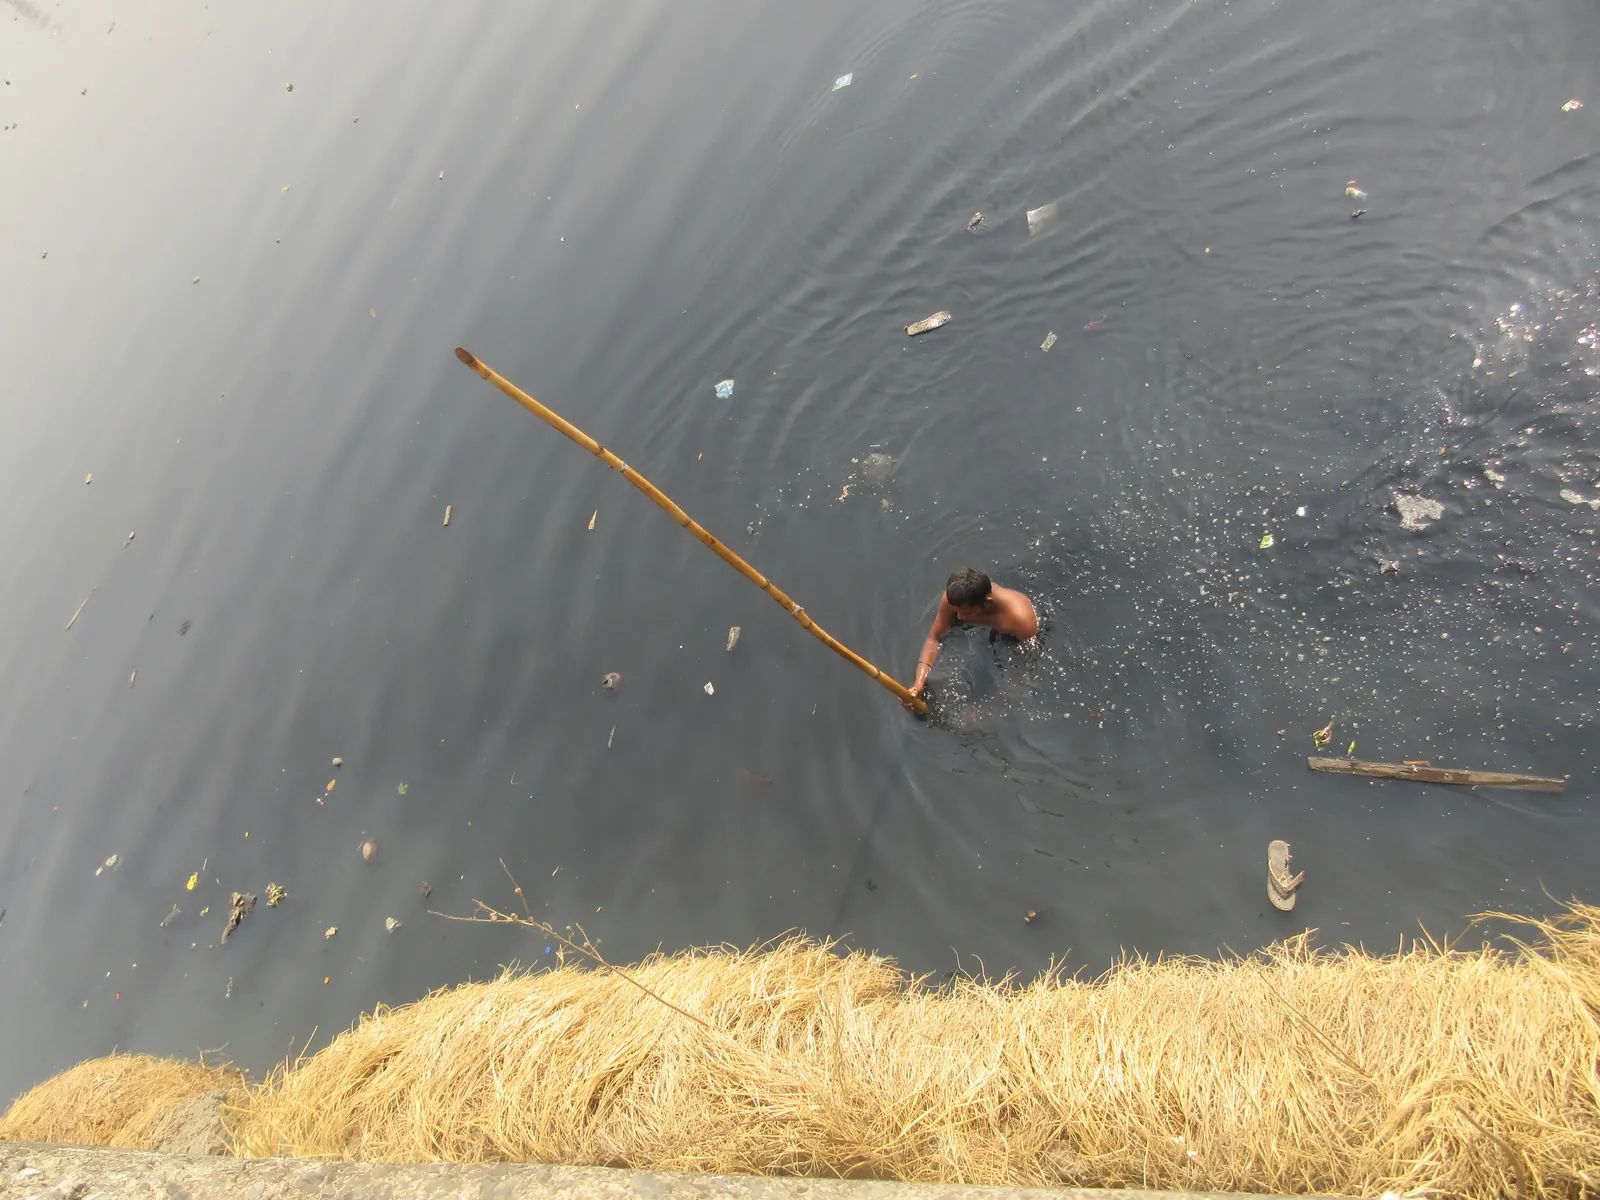
Earth5R’s field reports from Powai Lake in Mumbai describe how sunlight breaks floating plastic into microplastics and eventually into nanoplastics smaller than 100 nanometres.[9] At an Earth5R BlueCities Network meetup, Dr. V Prakash Ranjan, Assistant Professor of Environmental Engineering at IIT Jammu, presented his research on plastic-lined paper cups: each cup filled with 100 ml of a hot beverage released about 25,000 microplastic particles, between 150 nanometres and 4.75 micrometres in size.[10]
Microplastic control has two halves. Collecting large plastic stops future fragments. Choosing products that shed less, from tyres and textiles to food packaging, stops the particles that never become litter at all.
1 to 3 billion
The Ganga basin may carry up to 3 billion microplastics a day to the sea, and nine in ten are fibres from clothes and fabrics
In 2019, a team led by the University of Plymouth with Indian and Bangladeshi partners sampled surface water at 10 sites along the Ganga in India and Bangladesh, from the Himalayan headwaters to the delta, collecting 120 samples. Microplastics were found in 71.6% of pre-monsoon samples and 61.6% of post-monsoon samples. More than 90% were fibres, mostly rayon (54%) and acrylic (24%). The researchers estimate that the Ganga-Brahmaputra-Meghna basin, home to about 655 million people, could be releasing 1 to 3 billion microplastics into the Bay of Bengal every day.[3]
Newer Indian studies add other rivers. In the Narmada’s upper and middle basin, a February 2026 study found an average of 4,738 particles per cubic metre of surface water and 2,90,071 per cubic metre of sediment, with 19 different polymers including polyvinyl chloride and polyurethane. Tourist sites had the highest concentrations in surface water.[11] In the Brahmani River inside Odisha’s Bhitarkanika Wildlife Sanctuary, mangrove sediments held up to 50.4 items per kg dry weight, and the particles carried adsorbed heavy metals including chromium, cadmium and lead.[12]
Urban drains are a major route in. A June 2026 review of Indian research cites concentrations of 100 to 6,700 microplastics per cubic metre in the Najafgarh drain and the Yamuna, and estimates that sewage treatment plant effluent in the Ganga basin releases around 300 million microplastics a day.[4]
Fibres dominate river samples, and fibres come mostly from washing and wearing synthetic clothes. Textile choices and laundry habits are a water quality issue. Our brief on textile waste in India covers the clothing side.
+20 to 25%
Urban lakes act as traps: in one Chennai lake the microplastic load rose 20 to 25% in a single year
Lakes hold what rivers pass on. A two-year study of Ambattur Lake in Tamil Nadu, published in May 2026, found an average of 117.5 microplastics per litre of water, 144.3 per kg of sediment and 78.1 per cubic metre in plankton. The overall burden rose 20 to 25% in the second year. Deposition peaked after the monsoon, as catchment runoff washed fragments in.[13]
Land holds plastic too. A 2026 study of soils at open dump sites in five Indian megacities found Mumbai had the highest microplastic levels, followed by Bangalore, with New Delhi the lowest. The soils also carried plastic additives: phthalates were abundant, and Mumbai showed the most flame retardants.[14]
Earth5R has worked on lakes for over a decade, from Powai Lake cleanups and recycling in Mumbai to lake restoration work under the BlueCities Sustainability Network.
Cleaning a lake once does not reset it. Catchment segregation before the monsoon, and clearing plastic from drains and banks before the first rains, decides how much plastic enters the water each year.
89.15 per kg
Every salt and sugar sample tested in a 2024 Indian study contained microplastics, and food is the largest pathway into the body
In August 2024, the Delhi research group Toxics Link tested 10 types of salt, including table salt, rock salt, sea salt and local raw salt, and 5 types of sugar bought online and from local markets. Every sample contained microplastics. Salt held between 6.71 and 89.15 pieces per kg dry weight: the highest level was in packaged iodised salt and the lowest in organic rock salt. Sugar held 11.85 to 68.25 pieces per kg. The particles ranged from 0.1 to 5 mm and were mostly fibres, pellets, films and fragments of PET, HDPE and LDPE.[5]
The June 2026 review in Discover Public Health puts these findings together into an estimate of daily exposure. It suggests a person in India may take in about 2,012 particles a day, give or take 598, through food, air and drinking water combined. Inhalation alone may account for 325 to 863 particles a day in Indian metropolitan regions.[4]
How microplastics reach us in a day
Estimated particles per person per day in India, by pathway
Source: Verma and Kumar, Discover Public Health, 30 June 2026. Mean estimates compiled from Indian studies; ranges are wide.[4]
India’s food regulator is building the evidence base. In March 2024 the Food Safety and Standards Authority of India (FSSAI) started a project, “Micro- and Nano-Plastics as Emerging Food Contaminants: Establishing Validated Methodologies and Understanding the Prevalence in Different Food Matrices”, with CSIR-Indian Institute of Toxicology Research in Lucknow, ICAR-Central Institute of Fisheries Technology in Kochi and BITS Pilani.[15]
Standard testing methods come before any standard limits. The FSSAI project is the right foundation, and the most useful thing companies in food and packaging can do now is test their own supply chains with those methods as they emerge.
325 to 863
Indian research on microplastics in the air has grown more than a hundredfold since 2017, and points to fibres, tyres and road dust
The Discover Public Health review counted Indian publications on the subject rising from one in 2017 to 155 in 2025, about 12% of the global output.[4]
Indian research papers on airborne microplastics
Publications per year, bibliometric count
Source: Verma and Kumar, Discover Public Health, 30 June 2026.[4]
The review identifies textile fibres, traffic emissions, road dust, industry and indoor dust as the main sources of microplastics in the air. It cites studies finding that a single wash of synthetic clothing can release more than 1,900 fibres, and that up to 84% of atmospheric plastic particles in some areas come from road dust and tyre wear. About 45% of personal care products marketed in India were found to contain microplastics. Winter and post-monsoon stagnation, the same conditions that trap smog, also raise airborne microplastic levels.[4]
The review recommends adding airborne microplastics to air quality monitoring.[4] Our explainer on air pollution in India covers the wider particulate picture.
November is when Indian cities breathe their worst air. Microplastics ride along with that dust, which gives city air programmes a reason to sweep roads and manage dust carefully, and gives citizens one more reason to choose fewer synthetic textiles.
March 2027
India already has the core rules that cut microplastics at source, and a global treaty may arrive in March 2027
| Measure | What it does | Why it matters for microplastics |
|---|---|---|
| Microbeads in cosmetics | In 2017 the Bureau of Indian Standards added non-biodegradable polymeric microbeads to its list of raw materials not recognised as safe for cosmetics[16] | Removes a primary microplastic that washes straight into drains |
| Single-use plastic ban | Identified single-use plastic items prohibited from 1 July 2022[2] | Cuts small, light items that fragment fastest |
| Extended Producer Responsibility | Brands answer for collecting and processing their plastic packaging, with 2,614 processors registered[2] | Keeps packaging in a managed chain |
| Solid Waste Management Rules, 2026 | In force from 1 April 2026: segregation at source into wet, dry, sanitary and special care waste, with dry waste sent to material recovery facilities[17] | Clean dry waste can be recycled instead of dumped or burnt |
| FSSAI research project | Validated methods and prevalence data for micro and nanoplastics in food, since March 2024[15] | The evidence base for any future food standard |
The SWM Rules, 2026 also make bulk waste generators, such as campuses, large housing societies and commercial buildings producing 100 kg of waste a day or more, responsible for processing what they generate. They restrict landfills to non-recyclable, non-recoverable and inert waste, and require mapping and time-bound biomining of legacy dump sites.[17] Earth5R’s guide to the SWM Rules, 2026 explains what changes for households and companies, and the Plastic Waste and EPR Guide covers brand obligations.
Internationally, negotiations on a legally binding treaty on plastic pollution continue. At a short organisational session in February 2026, countries elected Chile’s Julio Cordano as chair of the Intergovernmental Negotiating Committee. The next formal session, INC-5.4, is scheduled for 13 to 24 March 2027, with informal heads of delegation meetings in Nairobi from 28 to 30 January 2027.[18] In October 2026 the chair said a deal could be possible in March if talks follow his roadmap.[19]
Each of these rules closes one route by which plastic becomes microplastic. All of them depend on households and businesses segregating every day, which is where community programmes add the most value.
642 items
What Earth5R pulls from the water: caps, sachets and multilayer wrappers, the small items that become tomorrow’s microplastics
Under the Know Your Plastics project, Earth5R volunteers sample and audit plastic waste in their own cities and share the data. In Thane, the “City of Lakes”, Earth5R volunteer Ruchit Kulkarni cleaned and sampled 10 locations and recorded 642 plastic items. Polythene carry bags (LDPE) were the largest group. Multilayer packaging, the foil-lined material of chip and snack packets, made up 22.7%, Tetra Paks 12.8%, HDPE 12.3% and PET bottles 4.4%.[20] The full report is on our Know Your Plastics page for Thane.
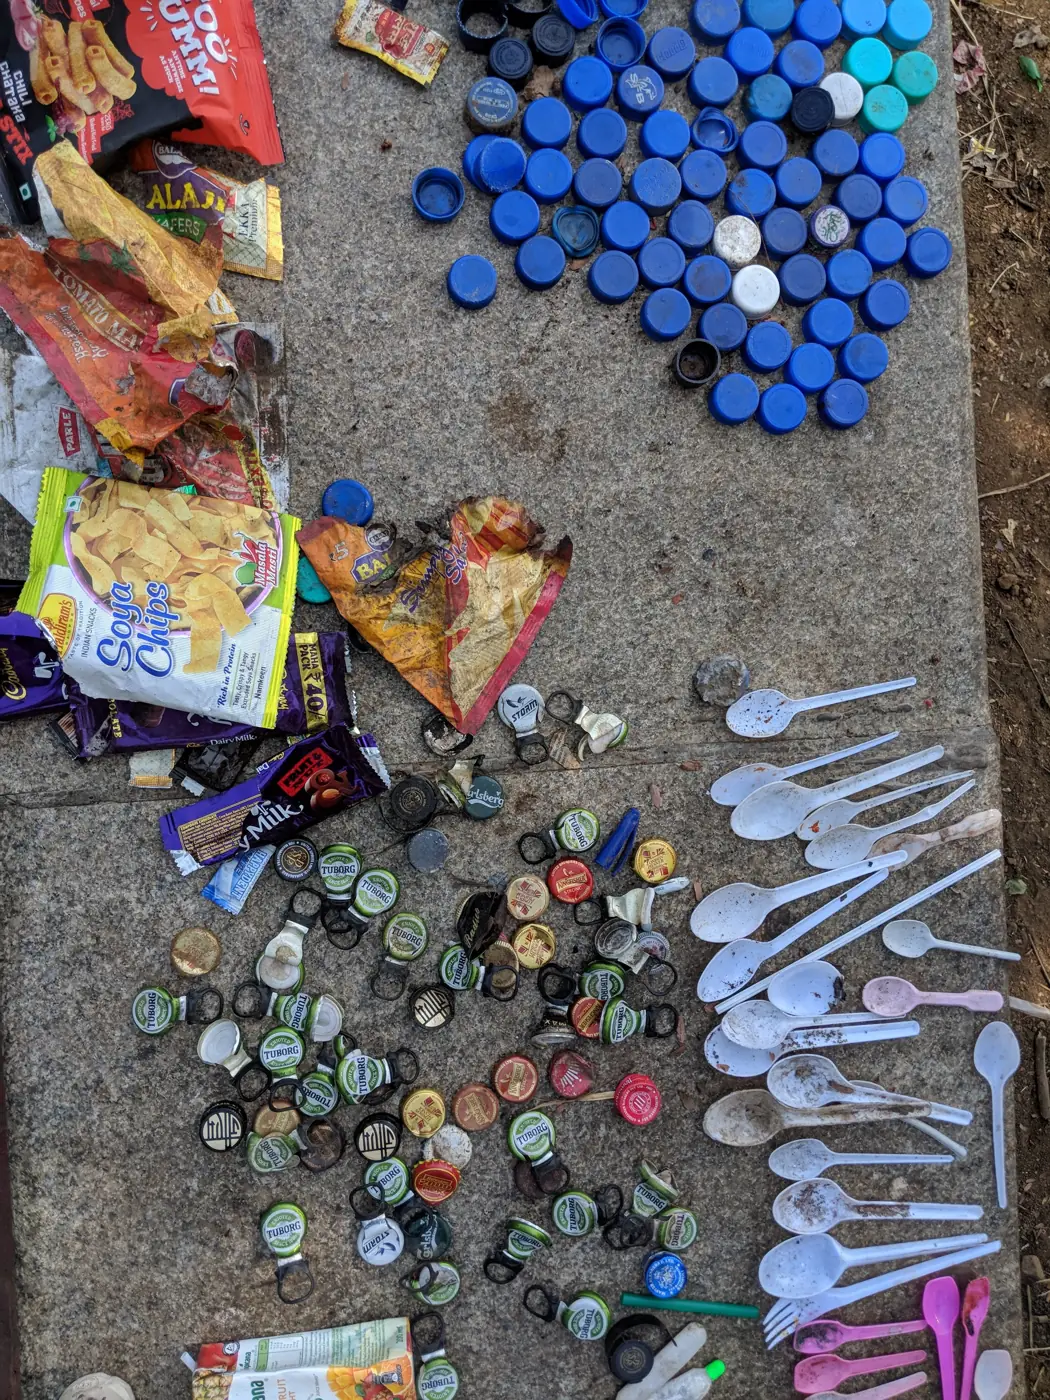
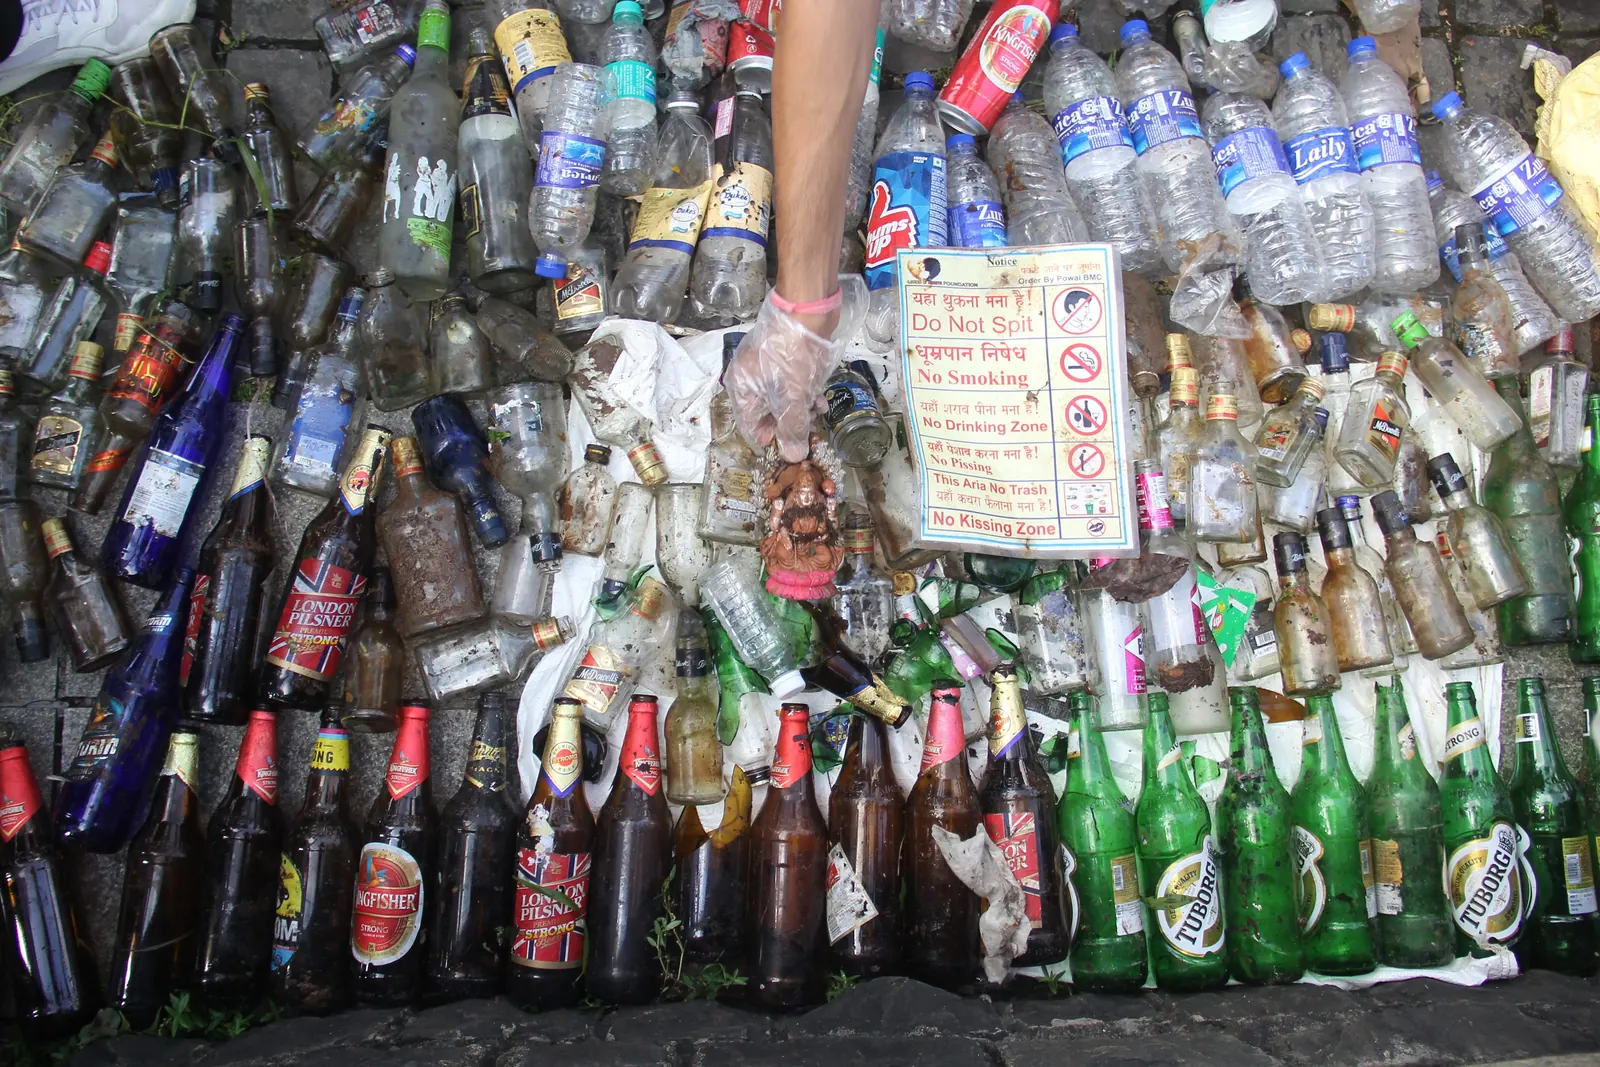
PET bottles, the item most people picture, were under 5% of the count. The bulk was film, sachets and laminates: thin, low-value plastic that few collect and that sun and water break down fastest.
At Powai Lake in Mumbai, Earth5R’s ACT Powai programme turned this into a focus on bottle caps. At the ninth ACT Powai cleanup, held at Powai Udyaan, Nick Anthony of the SEEK Phuket foundation joined students from Bombay Scottish School, and together they collected 500 bottle caps in an hour.[9] The caps are polypropylene, recyclable but tedious to gather and worth little to waste pickers, so the team set out to turn bottle caps into benches for public places. Over its first 12 weeks of regular cleanups, the team reported recycling 800 kg of plastic back into the circular economy rather than sending it to landfill.[21]
Earth5R figures in this section, such as 642 items audited in Thane, 500 bottle caps in one hour and 800 kg recycled in 12 weeks, are programme-reported on Earth5R’s own pages and have not been independently verified. They describe individual audits and events, not citywide results.
A cleanup that counts is a research tool. The items that dominate Earth5R audits, multilayer sachets, film and caps, are the items that most need better design, deposit schemes or dedicated collection to stop them fragmenting.
4,440 t
Case study: on the Mithi River, Earth5R recovered 4,440 tonnes of plastic before it could fragment in Mahim Creek
The Mithi River runs 17.8 km from Vihar and Powai lakes to the Arabian Sea at Mahim Creek. Earth5R’s case study lists plastic, single-use packaging of LDPE and HDPE “fragmenting into microplastics that move downstream into the creek and the sea”, as one of the river’s main pollution sources.[22]
From October 2020 to November 2024, Earth5R ran a recovery programme on the river with United Nations Technology Innovation Labs, Huhtamäki Oyj, RiverRecycle and the Municipal Corporation of Greater Mumbai, supported by €0.6 million in funding. A solar-powered recovery unit intercepted floating plastic and moved it to the bank for segregation, washing and shredding. High-value plastic went to recycling, and low-value plastic was processed through pyrolysis into industrial oil rather than returning to landfill.[22]
The second half of the programme worked upstream. Earth5R trained 10,000 families and 500 businesses in the catchment in waste segregation and circular practices. Residents were paid for segregated plastic, and households learned to upcycle waste into paper bags, lamps and handicrafts. Recycling the recovered plastic is estimated to have avoided about 6,660 tonnes of CO₂e, reported as avoided emissions, with no carbon credits issued or claimed.[22]
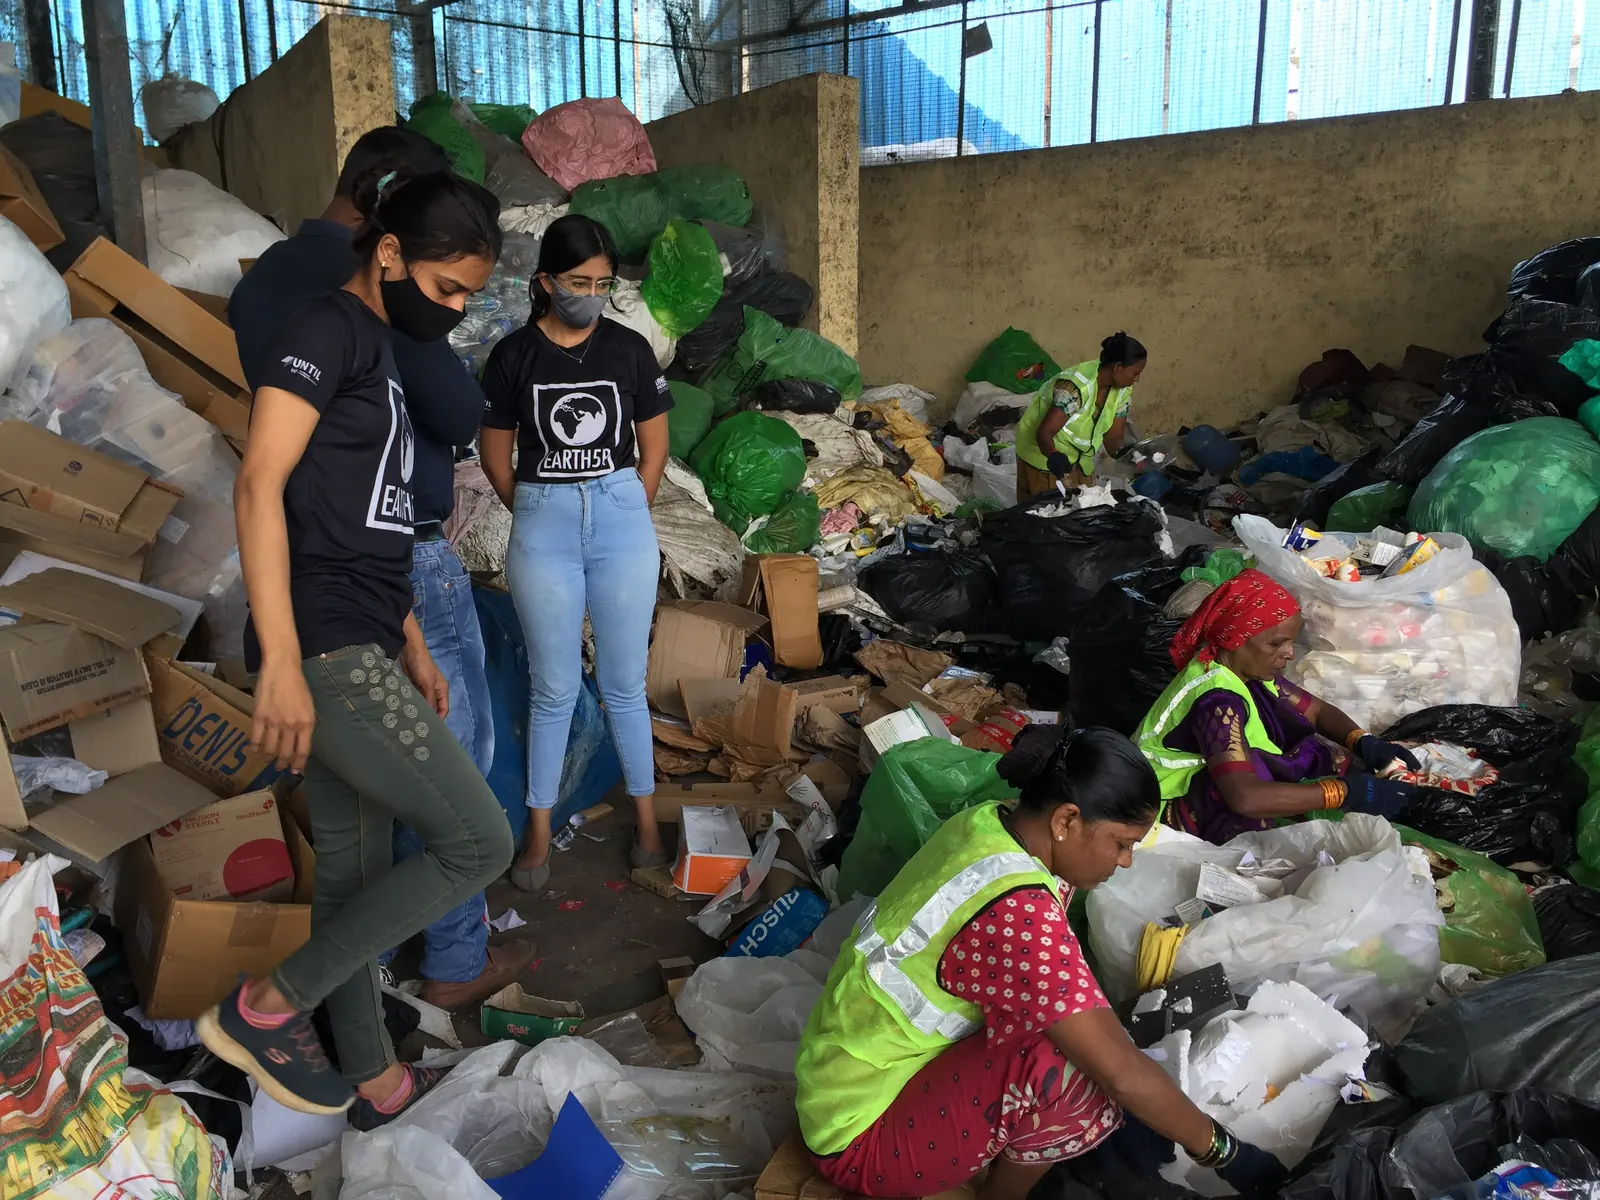
Earth5R designed and deployed the project and has since handed over operations to its delivery partners. The full record is in the Mithi River case study, and our river cleanup CSR project page explains how companies can fund similar work.
Mithi figures are programme-reported by Earth5R for its own project, covering October 2020 to November 2024. Avoided emissions are an estimate against a stated factor of 1.5 tonnes of CO₂e per tonne of plastic recycled. No carbon credits were issued or claimed by any party.
No technology can cheaply pull microplastics out of a river. Pulling out the large plastic before it breaks down can be done, and on the Mithi it was done at about 4 tonnes of plastic a day. The catchment training is what reduces the load arriving in the first place.
Plan a river or lake plastic programmeSee plastic waste ESG solutions
The five R’s for microplastics: the order matters, because recycling comes after three other decisions
In the words of founder Saurabh Gupta, “The 5R in Earth5R comes from a sequence we have taught since 2014: Respect, Reduce, Reuse, Recycle, Restore. The order matters. Respect comes first, respect for nature, for communities and for the limits of growth. A programme that starts at Recycle has skipped the three most important steps.”[23] Microplastics show why.
| R | What it means for microplastics | Evidence and Earth5R work |
|---|---|---|
| Respect | Start from the limits of bodies and ecosystems. Plastic reaches salt, sugar, plankton and the air we breathe, so the question is how much a lake, a mangrove or a person can safely carry. | Every Toxics Link salt and sugar sample was contaminated.[5] The Bhitarkanika mangroves are a sink for microplastics.[12] |
| Reduce | Cut plastic at source, especially the small, thin and hot-use items that shed or fragment fastest: sachets, film, plastic-lined cups and microbeads. | A hot drink in a lined paper cup released about 25,000 particles in research presented at an Earth5R BlueCities meetup.[10] India listed microbeads as unsafe for cosmetics in 2017.[16] |
| Reuse | Extend the life of bottles, bags, containers and clothes, and wash synthetic clothes less often and more gently. | A single wash can release more than 1,900 fibres, and fibres were over 90% of Ganga microplastics.[4][3] |
| Recycle | Keep plastic whole and clean until it reaches a recycler, and return value to the people who collect it. | Mithi residents were paid for segregated plastic, and 4,440 tonnes went to recycling or pyrolysis.[22] ACT Powai reported 800 kg recycled in 12 weeks.[21] |
| Restore | Rebuild rivers, lakes and the citizen science that tracks them, so recovery can be measured and trusted. | Know Your Plastics audits turn cleanups into data.[20] Ambattur Lake shows why monitoring has to continue year on year.[13] |
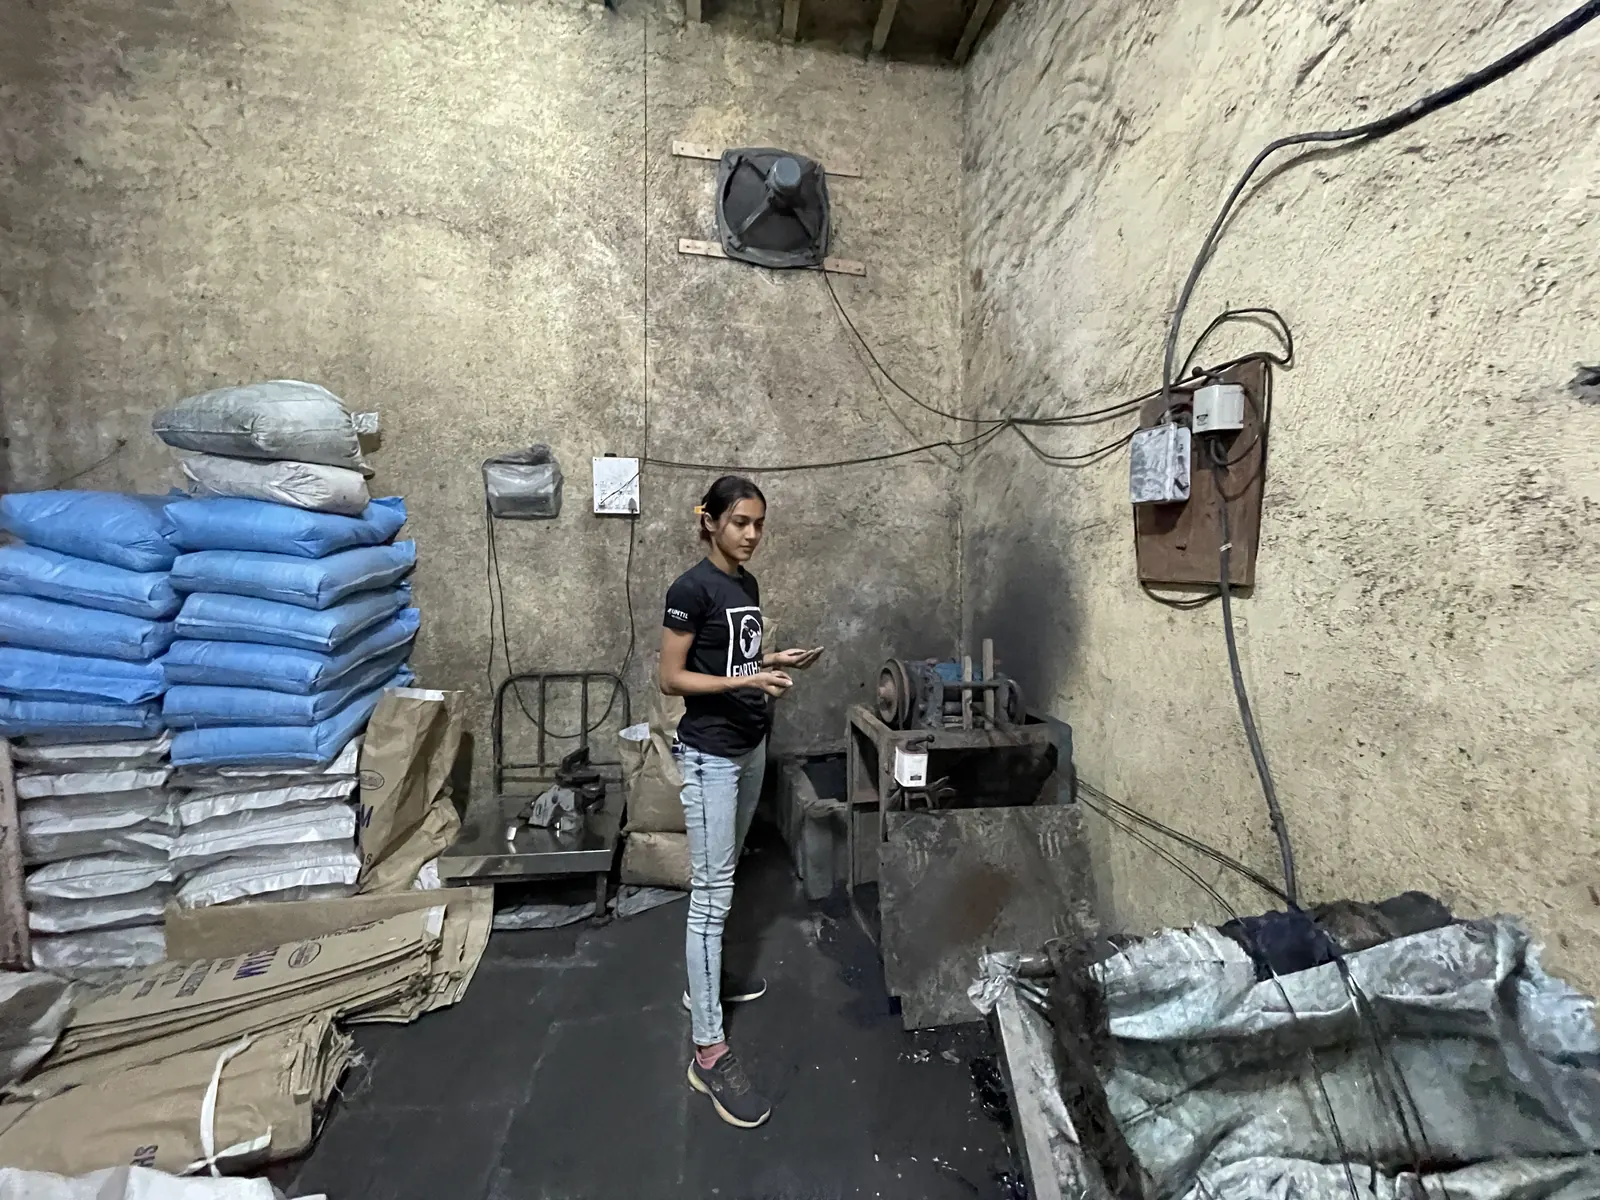
Recycling cannot catch a particle smaller than a grain of sand. Respect, Reduce and Reuse are where microplastics are stopped, and Recycle and Restore are what keep the large plastic from becoming the next generation of fragments.
What companies, housing societies and cities can do about microplastics, and what they should measure
Most organisations cannot yet measure particles in their own operations, but they can measure what drives them.
- Count the small formats. Audit how many sachets, multilayer wrappers, caps and films a brand or campus puts out. Earth5R audits show these, not bottles, dominate what reaches water.[20]
- Segregate dry waste at source. The SWM Rules, 2026 require bulk waste generators to manage what they produce. Clean, separate dry waste is what material recovery facilities can recycle.[17]
- Fund collection where it is missing. Uncollected waste drives 53% of India’s estimated plastic emissions, so CSR money spent on closing collection gaps in under-served wards does more for microplastics than any filter.[1]
- Clear the catchment before the monsoon. Lake loads peak after the rains.[13]
- Choose lower-shedding materials. Uniforms, packaging and hot-drink cups are procurement decisions, and fibres and lined cups are clear sources.[3][10]
- Report it honestly. For BRSR and ESG disclosures, report plastic recovered and recycled separately from avoided emissions, and do not present avoided emissions as credits, as the Mithi project does.[22]
Residents and employees can take part through the Earth5R App, which includes waste hotspot surveys, water ecosystem surveys and training on the five R’s. Coastal programmes are covered in our beach cleanup brief, and festival plastic in our festival waste brief.
Talk to Earth5R about a plastic programmeRead the Plastic Waste and EPR Guide
Frequently asked questions about microplastics in India
- What are microplastics?
- Microplastics are plastic pieces smaller than 5 mm. Some are made small, such as microbeads and industrial pellets. Most form when larger plastic, such as bags, sachets, tyres and synthetic textiles, breaks down in sun, water and wear.[6][9]
- Are there microplastics in Indian salt and sugar?
- Yes. A 2024 Toxics Link study found microplastics in all 10 salt and 5 sugar samples it tested, at 6.71 to 89.15 pieces per kg in salt and 11.85 to 68.25 pieces per kg in sugar.[5]
- How many microplastics does a person in India take in each day?
- A 2026 review of Indian studies estimates about 2,012 particles a day, give or take 598, with food about 1,036, air about 594 and drinking water about 382. These are estimates with wide ranges.[4]
- Which Indian rivers have microplastics?
- Studies have found microplastics in the Ganga, the Yamuna, the Narmada and the Brahmani, among others. The Ganga basin may carry 1 to 3 billion particles a day into the Bay of Bengal.[3][4][11][12]
- Is India regulating microplastics?
- India listed microbeads as unsafe for cosmetics in 2017, banned identified single-use plastic items from July 2022, runs EPR for plastic packaging, and requires segregation at source under the SWM Rules, 2026. FSSAI is developing methods to test food.[16][2][17][15]
- What is Earth5R doing about microplastics?
- Earth5R removes large plastic before it fragments and works upstream on segregation. On the Mithi River it recovered 4,440 tonnes of plastic and trained 10,000 families, and its Know Your Plastics audits record which items reach the water.[22][20]
Related reading on Earth5R
References
- Cottom, J. W., Cook, E. and Velis, C. A. (2024). A local-to-global emissions inventory of macroplastic pollution. Nature 633: 101 to 108. doi.org/10.1038/s41586-024-07758-6
- Ministry of Environment, Forest and Climate Change (2024). Plastic waste management: reply in the Rajya Sabha. Press Information Bureau, 12 December 2024, citing CPCB annual reports and the centralised EPR portal. pib.gov.in
- Napper, I. E., Baroth, A., Barrett, A. C., Bhola, S. et al. (2021). The abundance and characteristics of microplastics in surface water in the transboundary Ganges River. Environmental Pollution 274: 116348. doi.org/10.1016/j.envpol.2020.116348
- Verma, S. K. and Kumar, R. (2026). A comprehensive review of microplastics in India as emerging air pollutants with implications for current trends and future perspectives. Discover Public Health 23, 30 June 2026. doi.org/10.1186/s12982-026-02510-z
- Toxics Link (2024). Microplastics in Salt and Sugar. Study and press release, New Delhi, August 2024. toxicslink.org
- OECD (2022). Global Plastics Outlook: Economic Drivers, Environmental Impacts and Policy Options. Chapter 1, Overview and policy highlights. OECD Publishing, Paris, 22 February 2022. oecd.org
- Landrigan, P. J., Dunlop, S. A., Treskova, M., Raps, H. et al. (2025). The Lancet Countdown on health and plastics. The Lancet 406(10507): 1044 to 1062. doi.org/10.1016/S0140-6736(25)01447-3
- Lok Sabha (2024). Unstarred Question No. 2275, answered 9 December 2024, on plastic waste management units under Swachh Bharat Mission (Grameen). sansad.in
- Mukhopadhyay, A. and Griffin, E. (reporters). Continuing to tackle the Powai Lake plastic pollution problem. EarthJournal, Earth5R, ninth ACT Powai cleanup. Programme-reported. earth5r.org
- Earth5R. Inside BlueCities Network: innovations in urban sustainability and microplastic pollution. EarthJournal, meetup report. earth5r.org
- Parida, D., Katare, K., Kiran, K., Nogueira, R. et al. (2026). Distribution and characterization of microplastics in Narmada River: insights from differently impacted anthropogenic zones of upper and middle basin in Central India. Ecotoxicology and Environmental Safety 312: 119964, 27 February 2026. doi.org/10.1016/j.ecoenv.2026.119964
- Kumar, R., Das, M. M., Das, S., Verma, A. et al. (2026). Microplastic pollution in a tropical river and mangrove system of the Brahmani River in Bhitarkanika Wildlife Sanctuary, Odisha (India). Water, Air, and Soil Pollution 237(13), 14 April 2026. doi.org/10.1007/s11270-026-09428-x
- Sridhar, J., Mookkan, M., Musthafa M, S., Venmathi Maran, B. A. et al. (2026). Spatio-temporal dynamics of microplastic pollution in water, sediment, and plankton of Ambattur Lake, India: implications for aquatic health risks. Journal of Environmental Risk Impact and Claims, 13 May 2026. doi.org/10.1080/30702267.2026.2657828
- Tassawad, P., Chakraborty, P., Kajiwara, N. and Nakata, H. (2026). Microplastics and plastic additives pollution in open dump site soils from five megacities in India. Environmental Monitoring and Contaminants Research 6: 75 to 87. doi.org/10.5985/emcr.20260005
- Ministry of Health and Family Welfare (2024). FSSAI launches project to address microplastic contamination in food. Press Information Bureau, 18 August 2024. pib.gov.in
- Press Trust of India (2017). Government classifies microbeads as “unsafe” for cosmetic products. The Indian Express, 28 May 2017, on the Bureau of Indian Standards list of raw materials not recognised as safe for cosmetics. indianexpress.com
- Ministry of Environment, Forest and Climate Change (2026). Four-stream segregation of solid waste at source made mandatory under SWM Rules, 2026. Press Information Bureau, 28 January 2026. pib.gov.in
- UNEP Intergovernmental Negotiating Committee on Plastic Pollution (2026). Activities leading up to INC-5.4. UN Environment Programme. unep.org
- Agence France-Presse (2026). Plastic treaty talks chair sees deal possible in March. France 24, 1 October 2026. france24.com
- Kulkarni, R. (reporter) and Jasani, K. (editor). Tackling plastic waste at Thane with the Know Your Plastics project. EarthJournal, Earth5R. Programme-reported. earth5r.org
- Earth5R. Creating benches from plastic bottle caps, ACT Powai. EarthJournal. Programme-reported. earth5r.org
- Gupta, S. Mithi River plastic waste cleanup: what 11,100 tonnes actually took. Case study, October 2020 to November 2024. Earth5R. Programme-reported. earth5r.org
- Gupta, S. (2026). AI and Sustainability: Planetary Limits. EarthJournal, Earth5R. Section on the Earth5R method, Respect, Reduce, Reuse, Recycle, Restore. earth5r.org
How to cite this article
Earth5R (2026). Microplastics in India: Rivers, Salt, Air and What Earth5R Pulls from the Water. EarthJournal, Earth5R, 2 November 2026. https://earth5r.org/microplastics-india/
Figures are taken from the sources cited and were current on 2 November 2026. Microplastic studies use different sampling and counting methods, so concentrations from different studies should not be compared directly. Exposure figures are modelled estimates. Indian figures use lakh and crore. Earth5R figures are programme-reported and labelled as such.