India now uses close to 1.7 crore tonnes of polymers a year, reports about 41 lakh tonnes of plastic waste, and has pushed 233 lakh tonnes of plastic packaging through recycling under Extended Producer Responsibility since 2022. From 2025-26, rigid packaging must also carry recycled plastic. This brief sets out what the latest data on plastic waste in India shows, where plastic still escapes, and what a decade of Earth5R work on rivers, lakes and city streets teaches about keeping it in use, with the five R’s applied to plastic.
Plastic waste in India: the evidence at a glance
- How much plastic India uses and throws away
- Where plastic escapes
- The burning problem
- The global recycling gap
- The single-use plastic ban, four years on
- EPR: 233 lakh tonnes and counting
- Recycled content and reuse from 2025-26
- The people who sort India’s plastic
- What citizen data shows
- Case study: the Mithi River
- The global plastics treaty
- The five R’s for plastic
- What companies and cities can do
- Questions
Plastic is the most visible part of India’s waste, but it is also the part with the clearest route back into use. This brief follows plastic from the factory gate to the scrap shop, the riverbank and the recycler, and builds on our earlier research on microplastics in India, landfills in India and e-waste in India.
41.4 lakh t
India reports about 41 lakh tonnes of plastic waste a year, while the polymers that become it have grown by nearly a third since 2018-19
Plastic waste starts as polymer. According to the Department of Chemicals and Petrochemicals, India produced 13.38 million tonnes of polymers in 2024-25, up from 10.04 million tonnes in 2018-19, and consumed 16.82 million tonnes, up from 12.84 million tonnes.[2] Consumption grew about 31% in six years, and it runs ahead of domestic production, so part of the plastic India uses is imported.
Polymer production and consumption in India
Million tonnes a year, 2018-19 and 2024-25
Source: Department of Chemicals and Petrochemicals, Chemical and Petrochemical Statistics at a Glance 2025.[2]
Pipes and car parts last for years, while packaging is thrown away within days. The official count of plastic waste comes from State Pollution Control Boards, which report to the Central Pollution Control Board (CPCB). Their figures put plastic waste generation at 41,26,808 tonnes in 2020-21, 39,01,802 tonnes in 2021-22 and 41,36,188 tonnes in 2022-23.[1]
On a per person basis India is still a modest user. A 2022 government explainer, citing the Ministry of Housing and Urban Affairs, put India’s plastic consumption at 11 kg per person a year against a global average of 28 kg.[6] India’s challenge is less about how much each person uses and more about what happens to plastic once it is used, in a country with a fast growing market for packaged goods.
Polymer use is rising, and packaging is the fastest moving share of it. Plans for plastic waste in India have to start with what comes onto the market, not only with what is collected.
9.3 Mt
Independent modelling puts India’s plastic emissions at 9.3 million tonnes a year, mostly from waste that is never collected or is burned
Official figures count the plastic waste that municipal systems record. A 2024 study in Nature by researchers at the University of Leeds took a different approach. It modelled plastic waste across 50,702 municipalities worldwide, including flows that national reporting systems are not designed to capture, such as rural waste, open burning and informal recycling.[7]
The study estimated global plastic emissions into the environment at 52.1 million tonnes a year in 2020, about 57% of it burned in the open and 43% left as debris. India’s estimate was the largest of any country, at 9.3 million tonnes a year, or nearly one fifth of the global total. Nigeria (3.5 million tonnes), Indonesia (3.4 million tonnes) and China (2.8 million tonnes) followed.[7]
Modelled plastic emissions by country, 2020
Million tonnes a year of macroplastic released into the environment as debris or open burning
Source: Cottom, Cook and Velis, Nature, 2024. Central estimates; India’s range is 6.5 to 12.7 Mt.[7]
Two details matter for anyone designing a solution. First, the model put India’s waste collection coverage at about 81%, which means roughly 25.5 crore people, 18% of the population, live where waste is not collected, and they account for about 53% of India’s plastic emissions. Second, most of the rest, about 38%, comes from fires on dumpsites.[7]
Where India’s plastic emissions come from
Share of India’s modelled plastic emissions by source, 2020
Source: Cottom, Cook and Velis, Nature, 2024. “Other sources” is calculated by subtraction.[7]
Model estimates are not official statistics. The study combines machine learning and material flow analysis to fill gaps in reported data, and India’s central estimate sits inside a wide range of 6.5 to 12.7 million tonnes.
More than half of India’s plastic leakage, in this estimate, comes from places that waste collection does not yet reach. Extending collection to every street and village, and keeping fires off dumpsites, would do more than any single recycling technology.
5.8 Mt
Open burning, not litter, is the largest route by which plastic leaves India’s waste system
When people picture plastic pollution they picture bottles on a beach. The Nature study suggests the bigger share in India goes up in smoke. It estimated that 56.8 million tonnes of municipal solid waste a year is burned in the open in India, and that 5.8 million tonnes of that is plastic.[7]
The authors point out that open burning has not been a central part of the global treaty talks, even though, in their model, more plastic is burned worldwide than is left as debris, releasing a mix of potentially hazardous substances and climate-forcing emissions.[7]
A plastic bag that is burned does not show up on a beach survey, but it shows up in the air a neighbourhood breathes.
Every tonne of plastic that is collected and sold is a tonne not burned in a lane or on a dumpsite. Our brief on landfills in India shows how dumpsite remediation is shrinking the space where such fires start.
Cutting open burning depends on two things India is already building: collection that reaches every household, and a price for the low-value plastic that nobody wants to carry. Both are cheaper than treating the health effects of smoke.
9%
Only 9% of the world’s plastic waste is recycled, so India is working on a problem no country has solved
It helps to set India’s numbers against the global picture. The OECD’s Global Plastics Outlook found that world plastics production doubled between 2000 and 2019 to 460 million tonnes, and plastic waste more than doubled to 353 million tonnes. Only 9% of that waste was recycled.[5]
What happens to the world’s plastic waste
Share of global plastic waste by fate, 2019
Source: OECD, Global Plastics Outlook, 2022.[5]
The rest was incinerated (19%), sent to landfill (50%) or escaped waste management altogether (22%), ending up in uncontrolled dumpsites, open fires or rivers and seas. Plastics account for 3.4% of global greenhouse gas emissions, and recycled plastic still makes up only about 6% of total plastics production, at 29.1 million tonnes in 2019.[5]
The OECD called for wider use of Extended Producer Responsibility, deposit-refund systems and recycled content targets.[5] India has now put two of those three tools into law.
No country recycles its way out of plastic pollution. The best results come from less plastic at the start, collection that reaches everyone and a working market for recycled material, and India’s rules now point in all three directions.
8.6 lakh
The single-use plastic ban has grown from a notification into more than 8.6 lakh inspections and a market for alternatives
India’s Plastic Waste Management (Amendment) Rules, 2021 prohibited identified single-use plastic items with low utility and high littering potential from 1 July 2022.[6] The list covers items such as earbuds with plastic sticks, plastic flags, thermocol for decoration, plates, cups, cutlery, straws, wrapping film around sweet boxes and banners thinner than 100 microns.[6] Plastic carry bags thinner than 75 microns were prohibited from 30 September 2021, and those thinner than 120 microns from 31 December 2022.[6][1]
Enforcement has been steady, with the figures above reported by August 2026 from State Pollution Control Boards and the SUP compliance monitoring portal.[3]
The ban has also helped grow a market for substitutes. The Ministry’s compendium of manufacturers and sellers of eco-alternatives, released on World Environment Day 2025, documents 1,064 businesses.[3] The Ministry marked World Environment Day 2025 under the theme “One Nation, One Mission: End Plastic Pollution”, with around 69,000 events and about 21 lakh participants in the month before it.[3]
Earth5R’s own early work began at the counter. In September 2015, volunteer Ayesha Mehrotra of Earth5R Bangalore visited shops in Thubrahalli, Whitefield, to explain why paper bags should replace plastic ones. Three of the five shops she visited agreed to stop using plastic carry bags and pledged to use cloth bags for heavy items such as rice and flour.[8] Her account is in Educating Bangalore shopkeepers on plastic pollution.
Bans work best on items that are easy to replace. The 1,064 eco-alternative makers in the government compendium are the other half of the ban: they give shopkeepers something to switch to. Earth5R volunteers used the same logic in Whitefield, where the two shops that did not switch straight away were encouraged to learn to make paper bags themselves.
233 lakh t
Extended Producer Responsibility has put 233 lakh tonnes of plastic packaging through recycling since 2022, and the register keeps growing
Extended Producer Responsibility (EPR) makes the companies that put plastic packaging on the market responsible for collecting and processing an equivalent amount. India’s EPR Guidelines for plastic packaging were notified on 16 February 2022. They set targets for recycling, for the reuse of rigid packaging and for the use of recycled content, and they apply to producers, importers and brand owners, known as PIBOs.[1]
Plastic packaging recycled under EPR since February 2022
Cumulative lakh tonnes, as reported to Parliament
Sources: Lok Sabha answers of 4 August 2025, 23 March 2026 and 10 August 2026.[9][1][3]
The cumulative figure has climbed quickly, from nearly 157 lakh tonnes in August 2025 to around 207 lakh tonnes in March 2026 and nearly 233 lakh tonnes in August 2026.[9][1][3] Registered PIBOs rose from 51,838 to 65,241 over the same period.[9][3]
The share of each EPR target that must be met through recycling, rather than end-of-life routes such as co-processing in cement kilns,[4] rises every year. For rigid packaging (Category I) it moves from 60% in 2025-26 to 70% in 2026-27 and 80% from 2027-28. For flexible and multilayered packaging (Categories II and III) it moves from 40% to 50% and then 60%.[1]
| Packaging category | 2024-25 | 2025-26 | 2026-27 | 2027-28 onwards |
|---|---|---|---|---|
| Category I, rigid | 50% | 60% | 70% | 80% |
| Category II, flexible | 30% | 40% | 50% | 60% |
| Category III, multilayered | 30% | 40% | 50% | 60% |
| Category IV, compostable | 50% | 60% | 70% | 80% |
Source: Ministry of Environment, Forest and Climate Change, Lok Sabha Starred Question No. 435, 23 March 2026.[1]
CPCB has followed up with enforcement. It issued show cause notices to registered PIBOs on 25 November 2024, 30 December 2024 and 11 March 2026 for not meeting EPR targets and not filing annual returns for 2022-23 and 2023-24.[1] For brands working out where they stand, our Plastic Waste and EPR Guide explains the obligations in plain language.
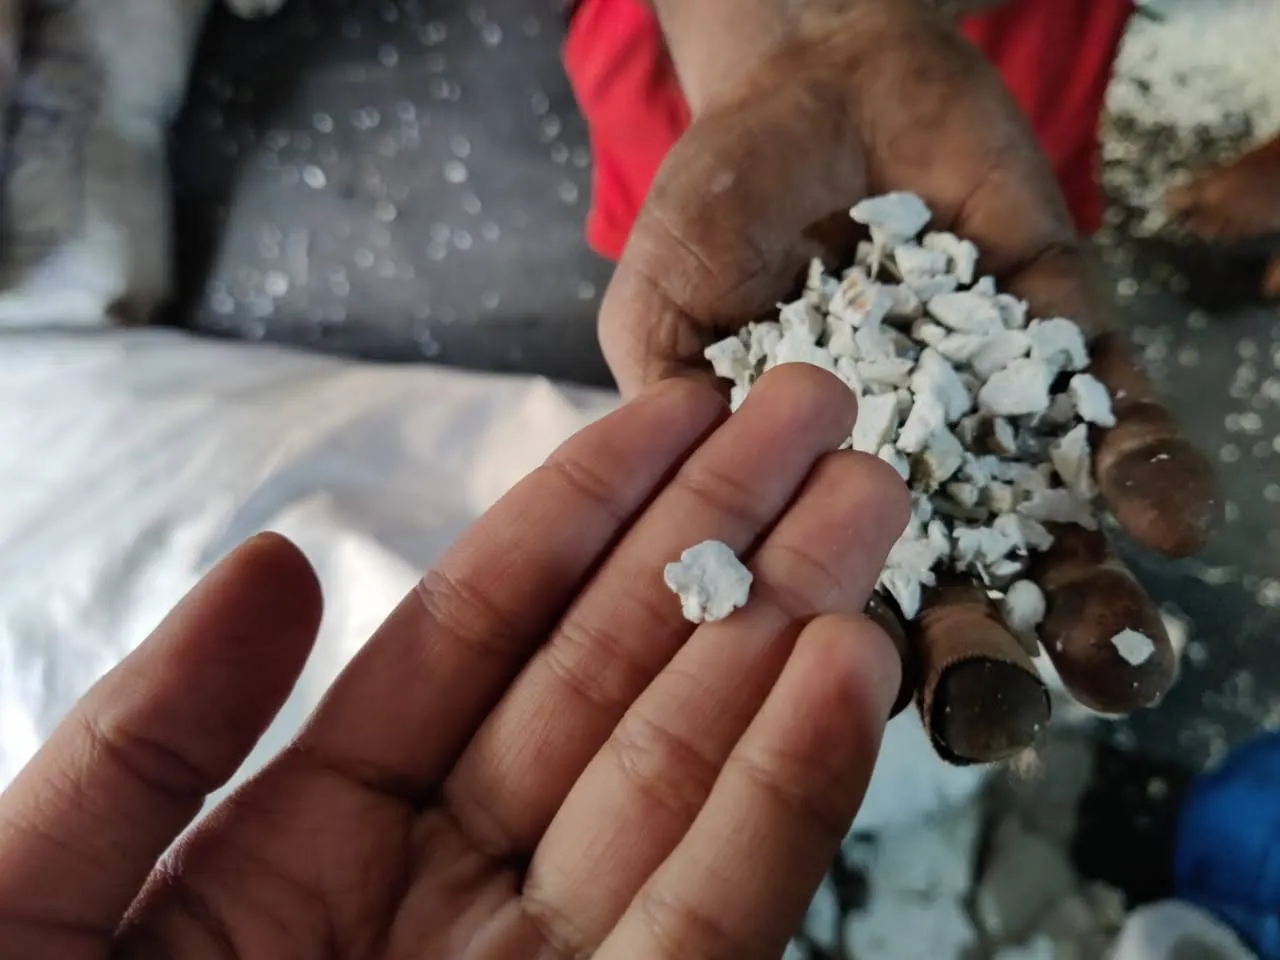
EPR has turned plastic recovery into a market, and that market is growing fast. Its value rises most when certificates are backed by plastic collected from streets and villages that are missed today.
30% to 60%
From 2025-26, rigid plastic packaging must carry at least 30% recycled plastic, rising to 60%, and brand owners must reuse a share of it
The Plastic Waste Management (Amendment) Rules, 2026, notified as G.S.R. 237(E) on 31 March 2026, moved the conversation from collecting plastic to using it again. Producers, importers and brand owners must now meet minimum recycled content targets in the packaging they place on the market.[4]
Minimum recycled content in rigid plastic packaging
Category I packaging, per cent of packaging made, imported or used in the year
Source: Plastic Waste Management (Amendment) Rules, 2026, G.S.R. 237(E), as summarised by Corporate Professionals.[4]
| Obligation | 2025-26 | 2026-27 | 2027-28 | 2028-29 onwards |
|---|---|---|---|---|
| Recycled content, Category I rigid | 30% | 40% | 50% | 60% |
| Recycled content, Category II flexible | 10% | 10% | 20% | 20% |
| Recycled content, Category III multilayered (plastic layers only) | 5% | 5% | 10% | 10% |
| Reuse, rigid packaging of 0.9 to 4.9 litres or kg | 10% | rising each year | 25% | |
| Reuse, drinking water packaging of 4.9 litres or more | 70% | rising each year | 85% | |
Source: Plastic Waste Management (Amendment) Rules, 2026, as summarised by Corporate Professionals, 7 April 2026.[4]
The amendment also tightens what counts. Recycled plastic packaging must meet Indian Standard IS 14534:2023, carry labelling that shows its recycled content and follow FSSAI requirements where it touches food. Turning plastic into feedstock or new plastic now counts as recycling, while co-processing, waste-to-energy, waste-to-oil and road construction are classed as end-of-life disposal.[4]
Where a law such as an FSSAI rule does not permit recycled plastic, no recycled content is due, and a 2025-26 shortfall for food-contact packaging can be carried forward over up to three years. Verification will be done by designated agencies and registered environment auditors.[4]
Recycled content targets create steady demand for clean, sorted plastic. Brands that secure supply from well-run collection systems now will find each rising target easier to meet.
5 lakh
Waste pickers do much of India’s plastic sorting, and more than 5 lakh of them have now been profiled under the NAMASTE scheme
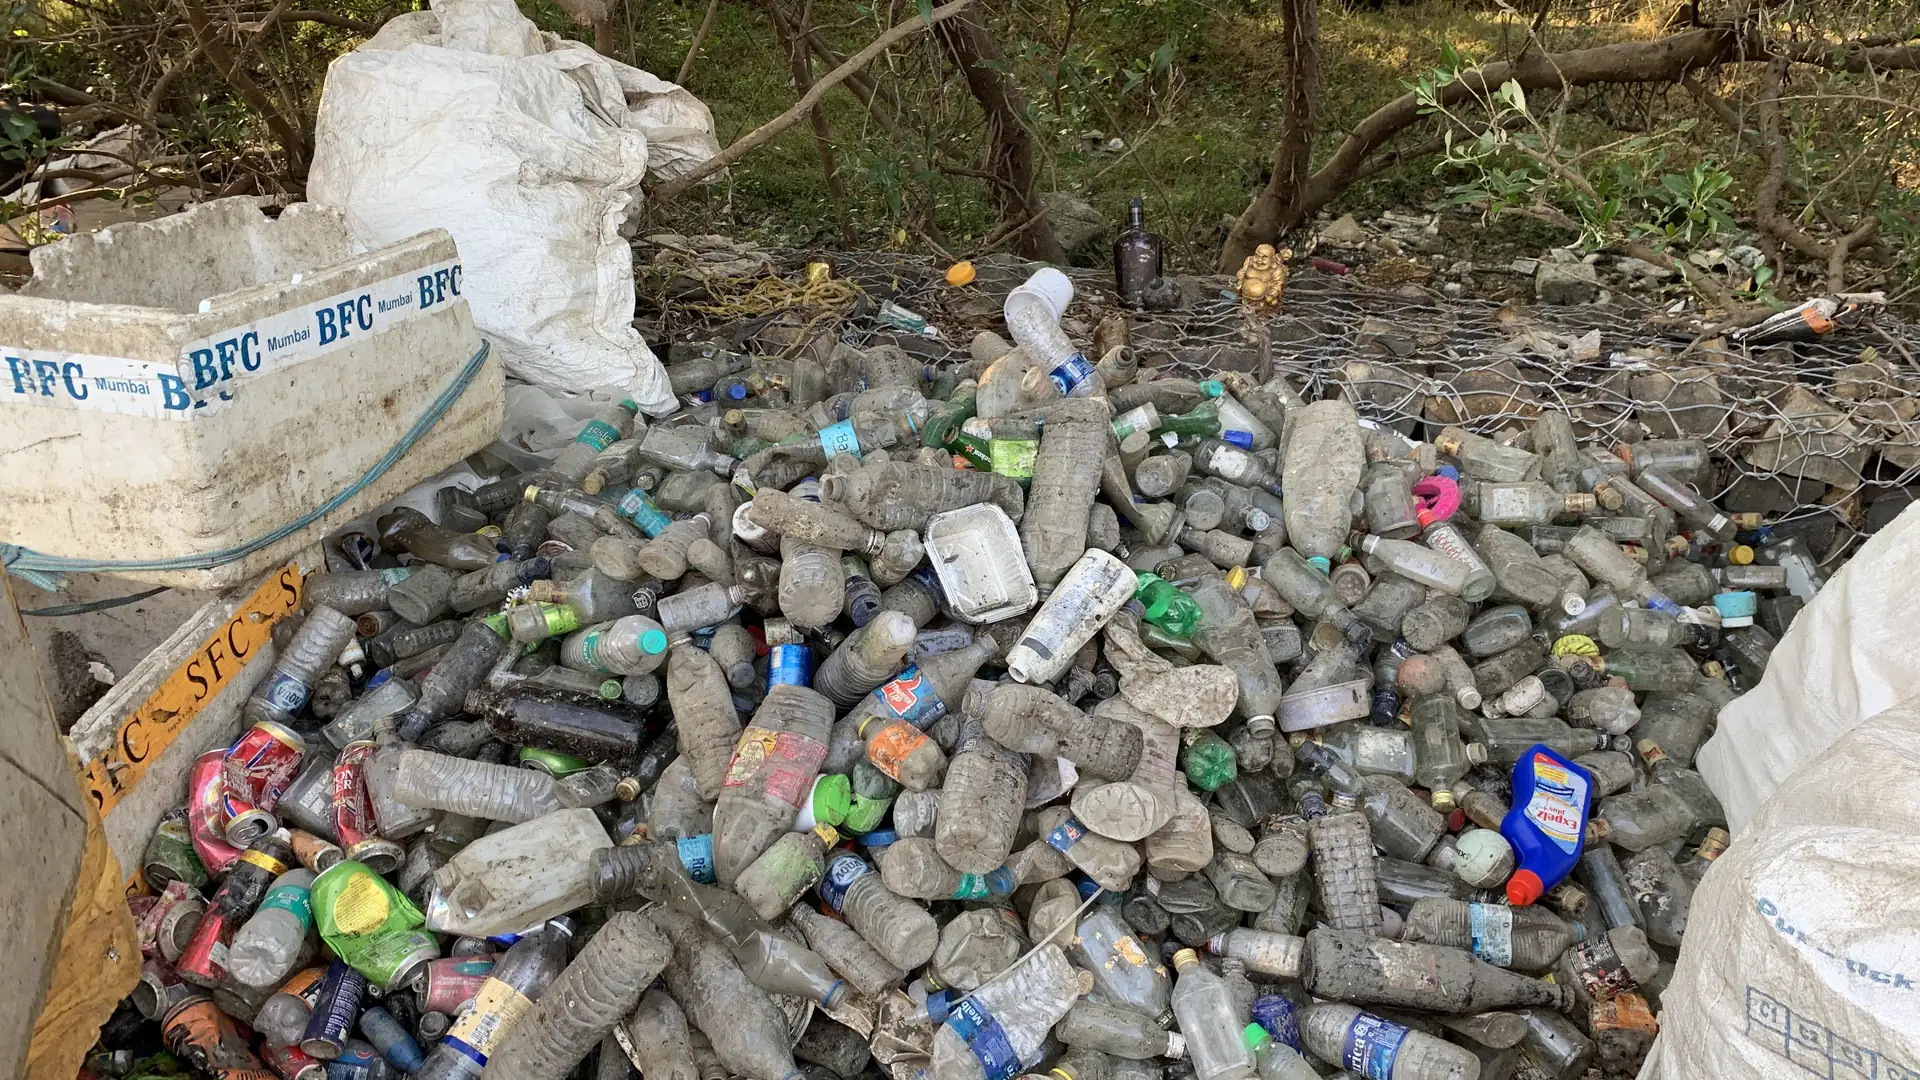
Before a bottle becomes a recycled flake, someone has picked it out of a bin or a drain, sorted it and sold it to a scrap shop. The Nature study notes that waste recycled by the informal sector is one of the flows national statistics do not capture.[7] Earth5R field visits to neighbourhood scrap shops and dry waste yards, like the ones pictured in this brief, show how that chain works in practice.
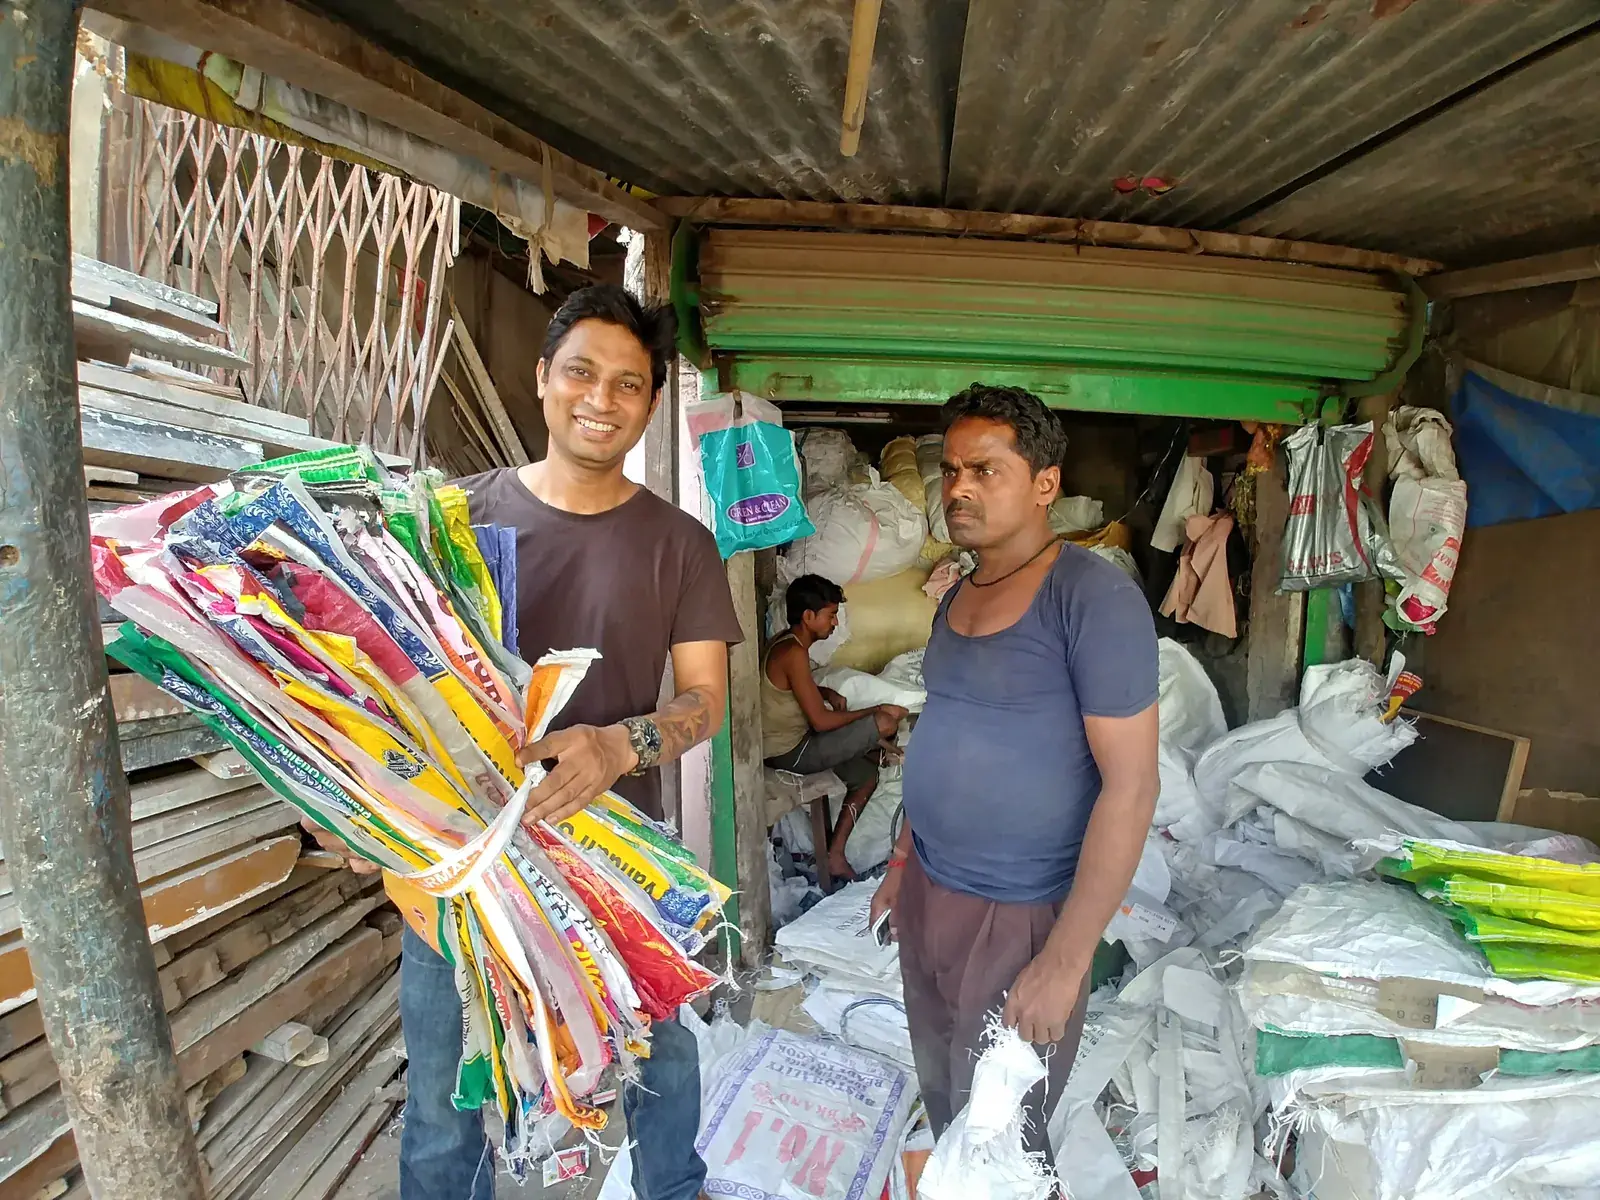
Government support for these workers is growing. Under the NAMASTE scheme of the Ministry of Social Justice and Empowerment, more than 5 lakh (5,00,013) waste pickers had been profiled by September 2026, of whom 3,15,593 had been validated, and 1,79,269 had received personal protective equipment kits.[10]
The infrastructure around them has also grown. Under Swachh Bharat Mission-Urban, urban India generates 1,62,162 tonnes of municipal solid waste a day, of which 1,31,837 tonnes is processed, an 81.30% processing rate against 16% in 2014.[11]
Recognising waste pickers, through identity, safety equipment and health cover, is also a plastic policy. Recycled content targets will only be met if the people who sort plastic are paid enough to keep doing it, and given safe places to do it in.
22.7%
A citizen audit in Thane found multilayer packaging made up more than a fifth of plastic litter, and bottles less than a twentieth
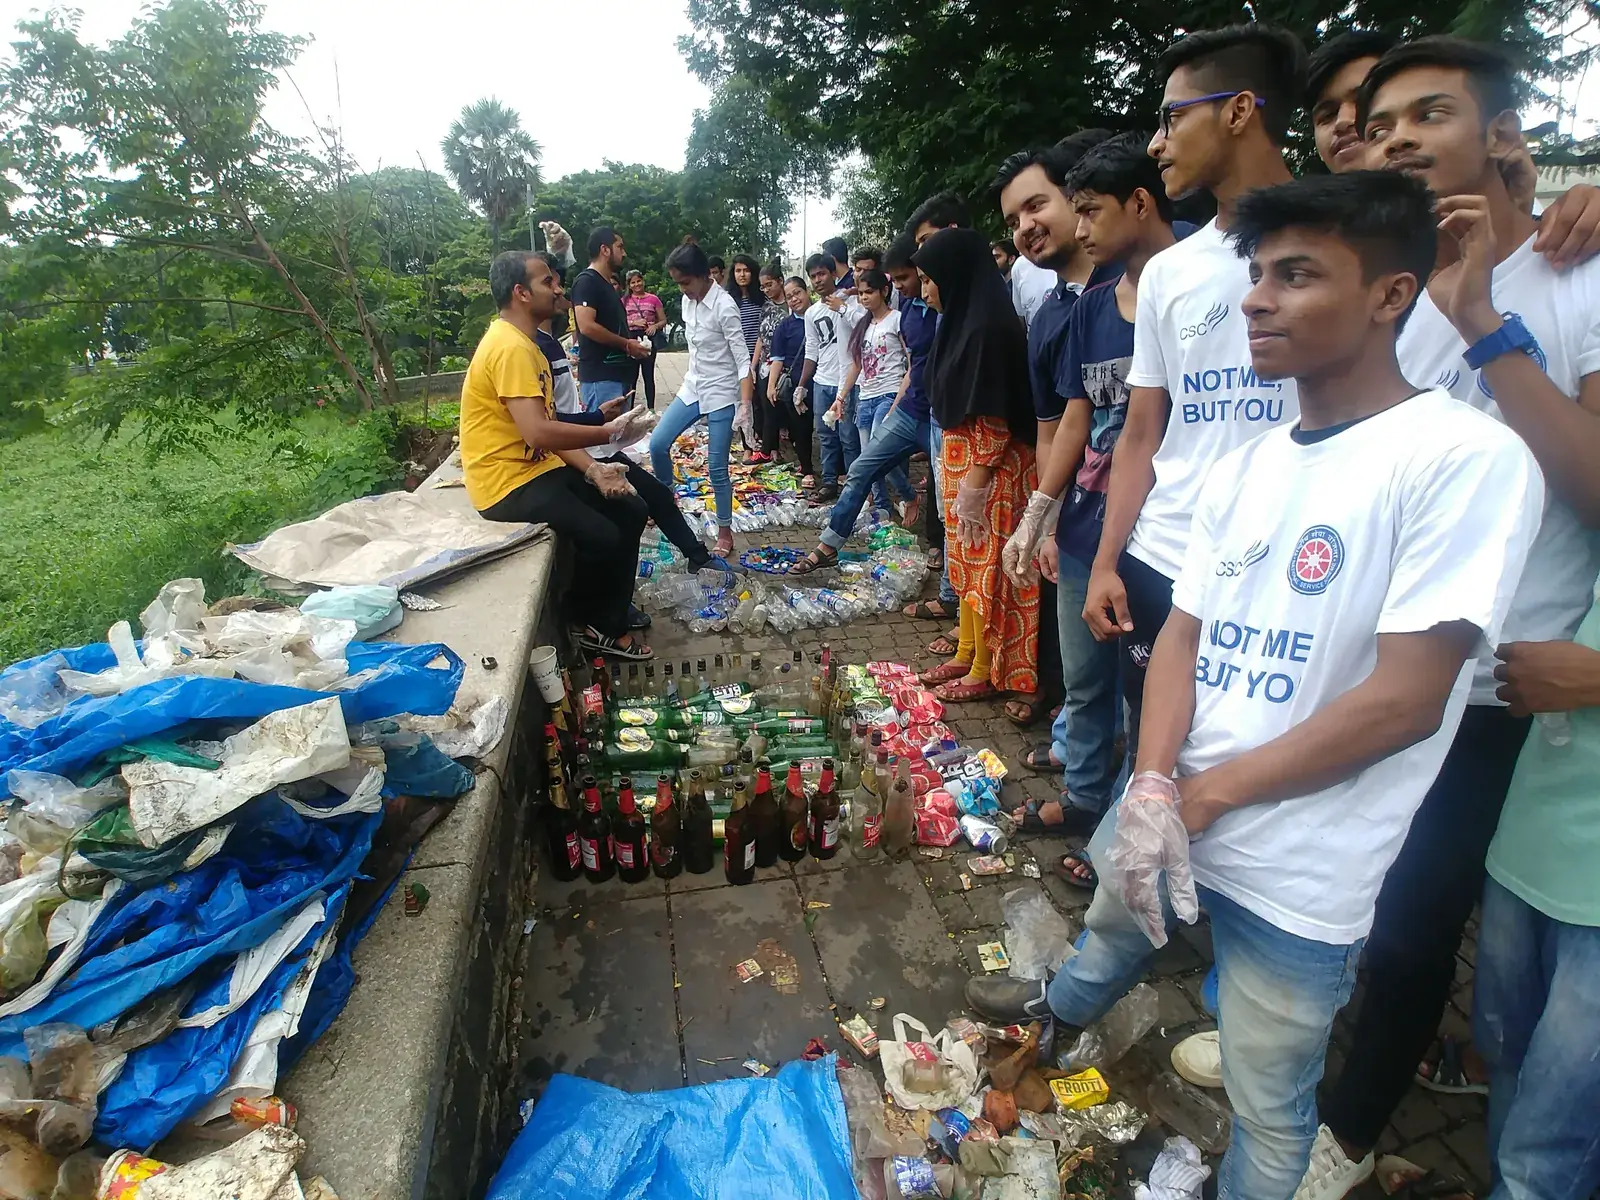
Street-level audits show which plastic it is, which tells a city and a brand what to fix first. Under Earth5R’s Know Your Plastics project, volunteer Ruchit Kulkarni cleaned up and sampled 10 locations in Thane and recorded 642 plastic items.[12] Polythene (LDPE) bags were the largest category. Multilayer packaging made up 22.7%, Tetra packs 12.8% (82 items), HDPE 12.3% and PET bottles only 4.4%.[12]
What a citizen scientist found in Thane
Share of 642 plastic items recorded at 10 locations, Earth5R Know Your Plastics project
Source: Earth5R, Know Your Plastics project, Thane. Polythene (LDPE) bags were the largest category; their share is not stated in the report.[12]
These are volunteer-collected counts from one city, reported by Earth5R. They show the mix of items at the sampled sites, not plastic waste for Thane or India as a whole.
PET bottles have a resale value, so collectors pick them up quickly, while sachets and thin bags stay on the ground. As Ruchit put it, “Rather than merely talking about the environmental issue, we should take action and through this project I could contribute some useful data from my city as a citizen scientist.”[12] His full findings are in Tackling plastic waste at Thane with the Know Your Plastics project.
Other Earth5R teams turned the same insight into action. Under the ACT Powai programme, the team ran regular cleanups for 12 weeks and recycled 800 kg of plastic back into the circular economy. Noticing that bottle caps were among the most common items found and earned collectors very little, the team set out to collect caps for recycled plastic benches around Powai Lake, each using up to 25 to 30 kg of plastic.[13] At the ninth ACT Powai cleanup, Nick Anthony of the SEEK Phuket foundation and students from Bombay Scottish School collected 500 bottle caps in an hour.[14] Read more in Creating benches from plastic bottle caps and Continuing to tackle the Powai Lake plastic pollution problem.
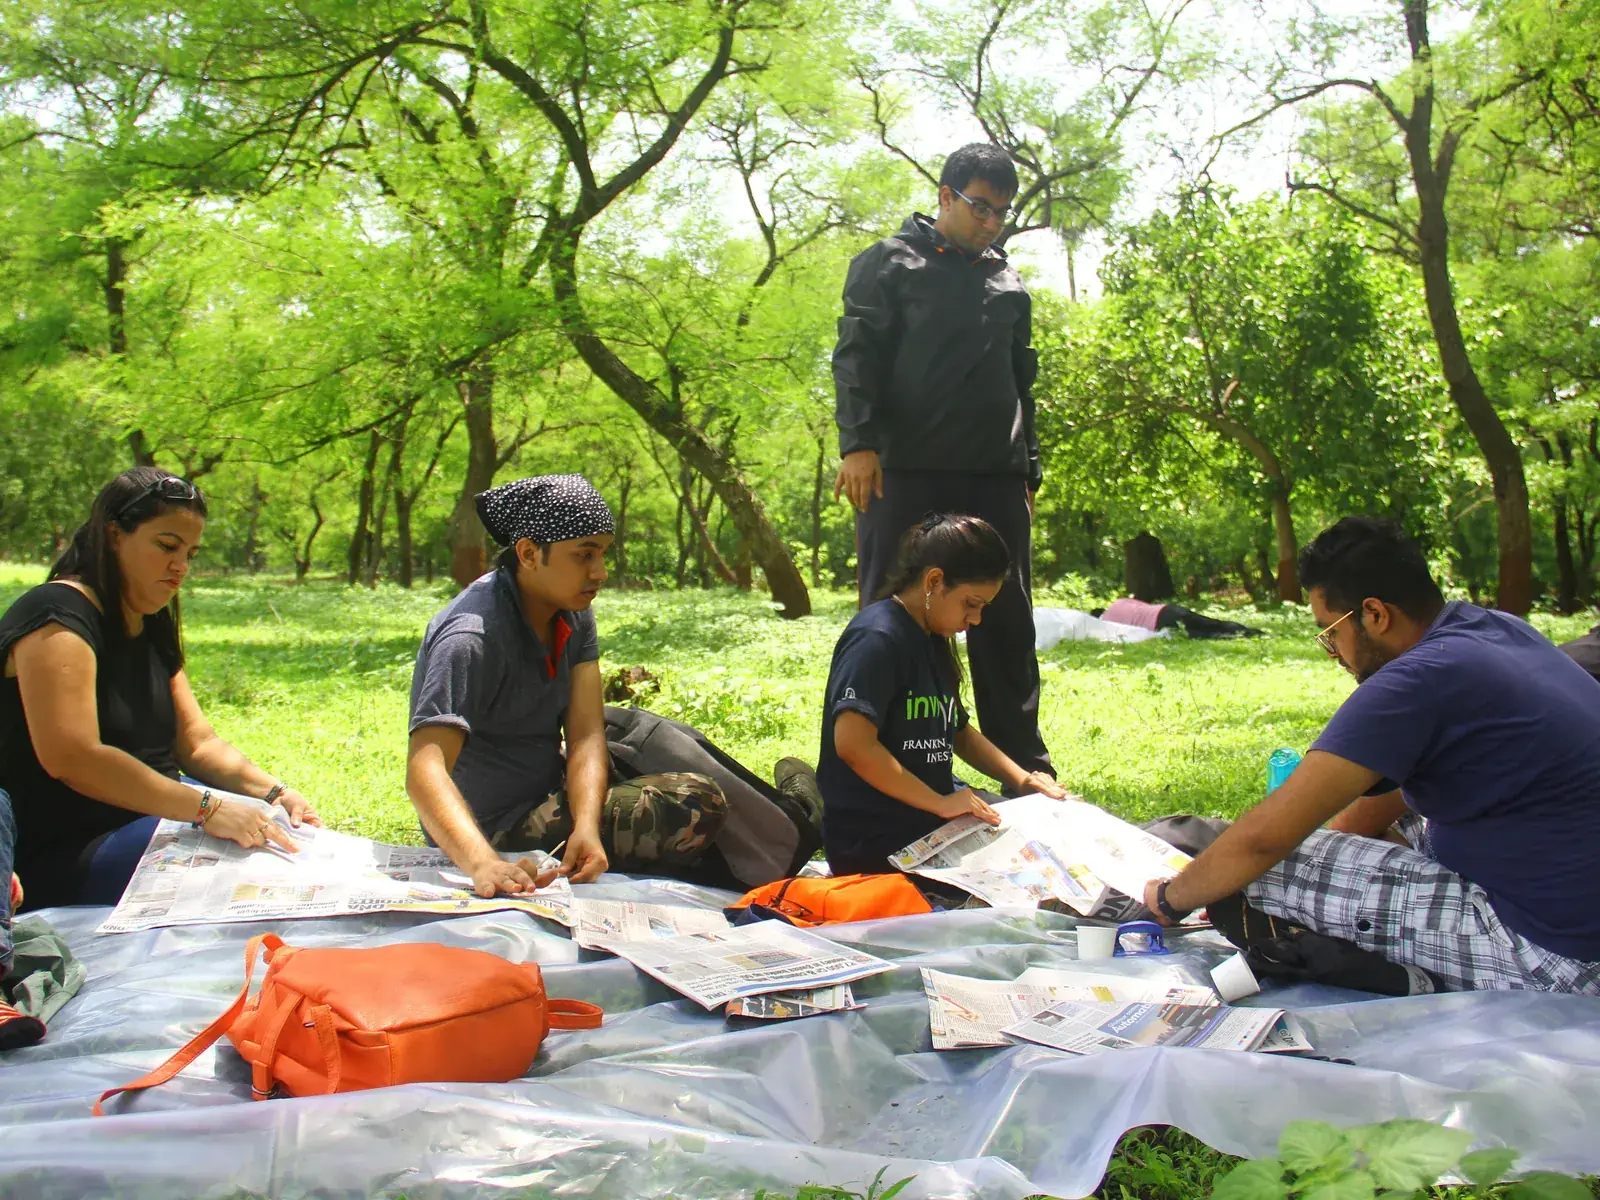
In a week-long Plastic Bottle Collection Programme, Earth5R Mumbai volunteers Sagar Kulkarni, Akshita Shah, Kaksha Mahudkar and Vandita Morarka each worked a different neighbourhood, in Thane, Naupada, Powai and Goregaon. They collected hundreds of bottles, which went to Hariyali to store and carry water for irrigation, a reuse rather than a recycling route.[15] See Plastic bottles recycling program at Mumbai. In Chandivali, children at a municipal school made eco-bricks from plastic waste for a tree guard, in an Earth5R upcycling workshop with the Swiss Staff Foundation.
The plastic that pollutes most is the plastic nobody will pay to collect. Multilayer sachets and thin bags are where design changes, EPR money and community collection drives make the biggest difference, because the market already takes care of the bottles.
4,440 t
Case study: on the Mithi River, 4,440 tonnes of plastic were recovered because the catchment was paid to keep it out of the water
The Mithi runs 17.8 km through the middle of Mumbai, from Vihar and Powai lakes to Mahim Creek. Between October 2020 and November 2024, Earth5R ran a river and catchment programme on it with United Nations Technology Innovation Labs, Huhtamäki, RiverRecycle and the Municipal Corporation of Greater Mumbai, supported by €0.6 million in funding.[16]
In the water, a solar-powered recovery unit built by Earth5R with RiverRecycle intercepted floating debris and moved it to the bank, where it was segregated, washed, dried and shredded. High-value plastics went to recyclers as manufacturing feedstock. Low-value plastics that recyclers could not take went through EU-approved pyrolysis into industrial-grade oil, so the residue had somewhere to go other than a landfill.[16]
What came out of the Mithi
Share of 11,100 tonnes of waste removed, October 2020 to November 2024
Source: Earth5R, Mithi River case study. Programme-reported; “other waste” is calculated by subtraction.[16]
On land, 10,000 families and 500 businesses in the catchment were trained in segregation and circular practice. Residents were paid for the segregated plastic they handed over, which turned waste into something with a price, and households learned to upcycle waste into paper bags, lamps and handicrafts. The operation averaged about 10 tonnes of waste a day, around 4 tonnes of it plastic.[16]
Mithi figures are programme-reported by Earth5R for October 2020 to November 2024. The estimated 6,660 tonnes of CO2e avoided by recycling the plastic is reported as avoided emissions against a stated factor. No carbon credits were issued or claimed by any party.
Earth5R designed and deployed the project and has since handed over operations, which continue under its delivery partners. The full record is in the Mithi River plastic waste cleanup case study, and our river cleanup CSR project page explains how companies can support similar work.
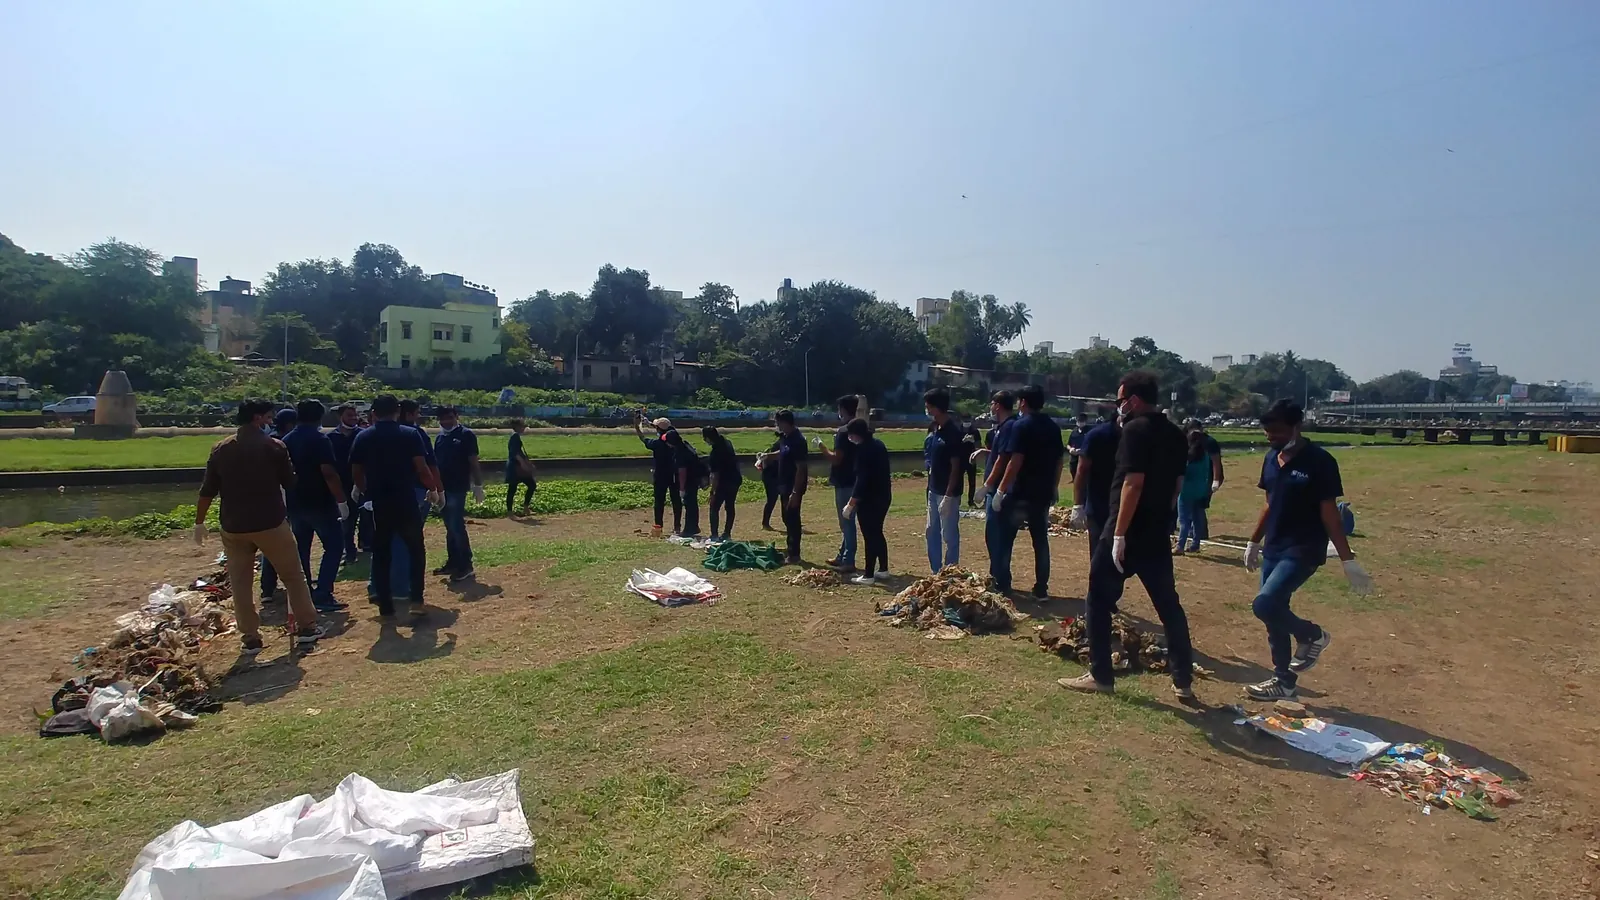
The machine caught plastic in the river. The payments and training on the bank reduced how much reached it. Programmes that fund only the machine end up running it for ever.
Jan 2027
The global plastics treaty is back on track, with the last informal meeting before the next negotiating round set for January 2027
Talks on a legally binding instrument on plastic pollution began in 2022, with sessions most recently in Korea and, in August 2025, Geneva.[17] After the Chair of the negotiating committee resigned, a one-day session in Geneva on 7 February 2026 was held to elect new officers, including the Chair.[17]
Work has moved steadily since. The first Aid to Negotiations, a text to help countries converge, was published on 8 August 2026, and heads of delegation met in Bangkok from 27 to 30 September 2026. In a letter dated 2 November 2026, the Chair described “promising areas of convergence” and set an informal meeting in Nairobi from 28 to 30 January 2027 as the last in-person meeting before the next formal session, INC-5.4.[18]
Whatever the final text says, India’s own rules on single-use items, EPR, recycled content and reuse already cover much of the ground the talks are discussing. For Indian companies that sell abroad, a treaty would make those domestic systems more valuable, not less.
Brands that build traceable recycled content and reuse systems for Indian rules now will be ready for whatever global standard follows, rather than having to rebuild their packaging twice.
The five R’s for plastic waste in India: recycling is the fourth step, not the first
In the words of founder Saurabh Gupta, “The 5R in Earth5R comes from a sequence we have taught since 2014: Respect, Reduce, Reuse, Recycle, Restore. The order matters. Respect comes first, respect for nature, for communities and for the limits of growth. A programme that starts at Recycle has skipped the three most important steps.”[19] Plastic is the clearest example of why the order matters, because most plastic policy talk begins at Recycle.
| R | What it means for plastic | Evidence and Earth5R work |
|---|---|---|
| Respect | Start from the limits of rivers, air and the people who sort waste by hand. Plastic that is burned or dumped lands on someone. | About 53% of India’s modelled plastic emissions come from uncollected waste.[7] More than 5 lakh waste pickers have been profiled under NAMASTE.[10] |
| Reduce | Cut plastic that has no route back, starting with items of low utility and high littering potential, and with sachets and thin bags. | India banned identified single-use items from 1 July 2022.[6] Earth5R volunteers persuaded three of five Whitefield shops to drop plastic carry bags.[8] |
| Reuse | Keep containers and bottles in use before they become waste. | Reuse targets for rigid packaging start at 10% and, for large drinking water containers, 70% in 2025-26.[4] Earth5R volunteers sent collected bottles to Hariyali for irrigation water.[15] |
| Recycle | Close the loop on material and on value, with a fair price for the people who collect and sort. | 233 lakh tonnes of packaging recycled under EPR since 2022.[3] On the Mithi, residents were paid for segregated plastic and 4,440 tonnes was recovered.[16] |
| Restore | Rebuild rivers, lakes and shorelines, and the public trust that comes from measuring what is removed. | Drone mapping on the Mithi tracked waste hotspots and change along the channel.[16] Citizen audits in Thane turned cleanups into data.[12] |
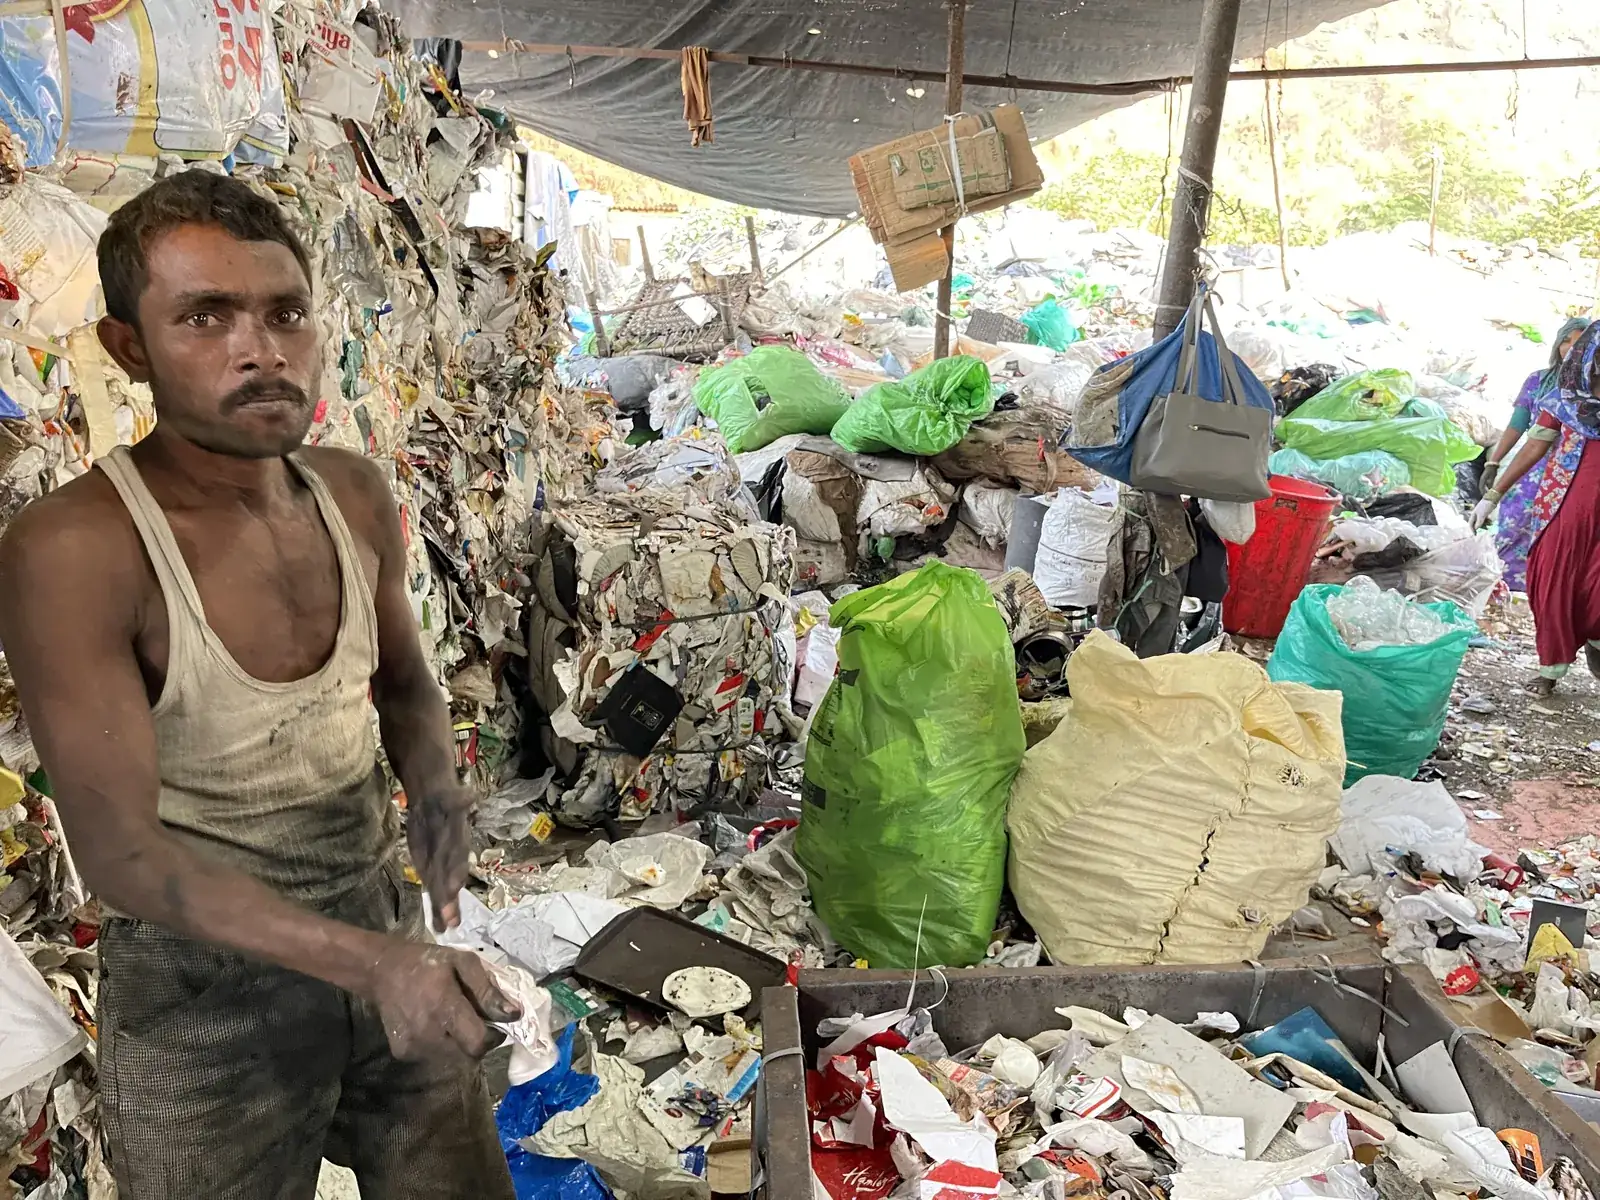
Most plastic money today goes to Recycle. Respect, Reduce and Reuse decide how much plastic needs recycling in the first place, and Restore is what tells a community the work has paid off.
What companies, housing societies and cities can do about plastic waste in India
Almost every organisation in India buys, sells or throws away plastic. The rules now reward those that plan ahead.
- Map your plastic footprint by category. Rigid, flexible and multilayered packaging carry different recycling and recycled content targets.[1][4]
- Secure recycled content early. Category I packaging needs 30% recycled content in 2025-26 and 60% by 2028-29, and it must meet IS 14534:2023.[4]
- Design out what nobody collects. Citizen audits keep finding sachets, multilayer wrappers and thin bags at the top of the litter list.[12] Mono-material and refill formats are cheaper than chasing them later.
- Fund collection where it is missing. Uncollected waste drives more than half of India’s modelled plastic emissions.[7] CSR and EPR budgets can support segregation and collection in the wards and villages systems do not yet reach.
- Pay the people who sort. Partnerships with waste picker groups and dry waste centres, with fair prices, safety equipment and health cover, make supply chains for recycled plastic more reliable.[10]
- Report it honestly. Disclose EPR certificates, recycled content and avoided emissions separately, and be clear about what is estimated. Earth5R’s plastic waste management and EPR intelligence work helps teams build that evidence base.
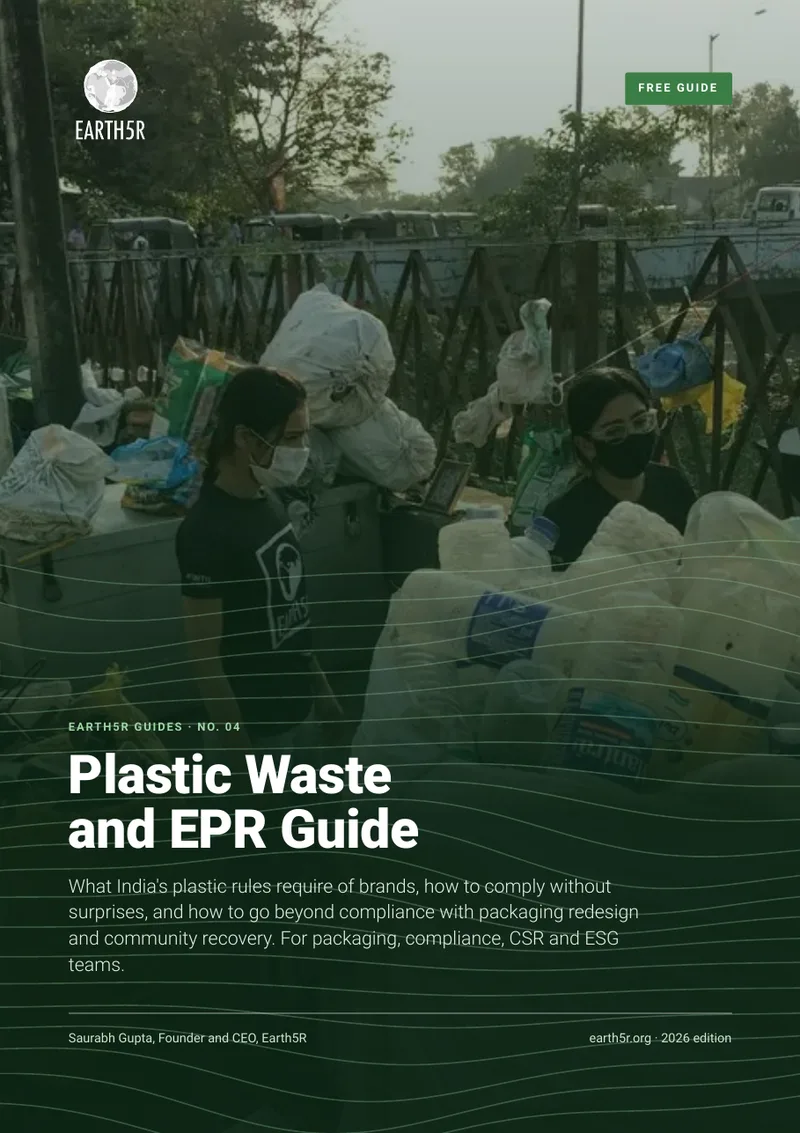
Free guide · Earth5R Guides No. 04
What India’s plastic rules require of brands, updated for the March 2026 amendment, and how to go beyond compliance, with an EPR tracker and policy template.
Plastic that escapes ends up on shores and in water. Our briefs on beach cleanups in India and food waste in India show how the same source-segregation habits keep both plastic and organic waste out of the environment.
Talk to Earth5R about a plastic programmeFree CSR and ESG guides
Frequently asked questions about plastic waste in India
- How much plastic waste does India generate?
- Based on reports from State Pollution Control Boards to CPCB, India generated 41,36,188 tonnes of plastic waste in 2022-23, compared with 39,01,802 tonnes in 2021-22 and 41,26,808 tonnes in 2020-21.[1] Polymer consumption reached 16.82 million tonnes in 2024-25.[2]
- What is EPR for plastic packaging in India?
- Extended Producer Responsibility requires producers, importers and brand owners to collect and process plastic packaging equivalent to what they place on the market, with rising minimum recycling levels, reuse targets for rigid packaging and recycled content targets. The guidelines were notified on 16 February 2022.[1]
- How much plastic is recycled in India?
- Nearly 233 lakh tonnes of plastic packaging waste has been recycled under EPR since February 2022, according to a Lok Sabha answer of 10 August 2026. By then 65,241 producers, importers and brand owners and 3,117 plastic waste processors were registered on the EPR portal.[3]
- Which single-use plastic items are banned in India?
- Since 1 July 2022, India has banned identified items including earbuds with plastic sticks, balloon sticks, plastic flags, candy and ice-cream sticks, thermocol for decoration, plastic plates, cups, cutlery, straws, stirrers, wrapping film around sweet boxes, invitation cards, cigarette packets and banners under 100 microns. Carry bags thinner than 120 microns have been banned since 31 December 2022.[6]
- What are the recycled content rules for plastic packaging from 2025-26?
- Under the Plastic Waste Management (Amendment) Rules, 2026, rigid packaging must contain at least 30% recycled plastic in 2025-26, rising to 60% from 2028-29. Flexible packaging starts at 10% and multilayered packaging at 5% of its plastic layers. Recycled plastic packaging must meet IS 14534:2023 and carry labelling.[4]
- What is Earth5R doing about plastic waste?
- Earth5R trains communities to segregate and recover plastic, runs citizen audits and cleanups, and designs river programmes. On the Mithi River in Mumbai, 4,440 tonnes of plastic were recovered between October 2020 and November 2024, and 10,000 families were trained in the catchment.[16]
Related reading on Earth5R
References
- Ministry of Environment, Forest and Climate Change (2026). Plastic packaging for food and water. Lok Sabha Starred Question No. 435, answered 23 March 2026. sansad.in
- Department of Chemicals and Petrochemicals (2025). Chemical and Petrochemical Statistics at a Glance 2025. Ministry of Chemicals and Fertilizers, paragraph 2.3.6. chemicals.gov.in
- Ministry of Environment, Forest and Climate Change (2026). National Plastic Waste Reporting Portal. Lok Sabha Unstarred Question No. 3580, answered 10 August 2026. sansad.in
- Corporate Professionals (2026). Plastic Waste Management (Amendment) Rules, 2026: strengthening EPR, recycled content and reuse obligations. Regulatory update on MoEFCC notification G.S.R. 237(E) of 31 March 2026, 7 April 2026. corporateprofessionals.com
- OECD (2022). Plastic pollution is growing relentlessly as waste management and recycling fall short, says OECD. Press release on the Global Plastics Outlook, 22 February 2022. oecd.org
- Press Information Bureau (2022). Ban on Single Use Plastic in India: Step towards Clean India, Green India. Explainer, Ministry of Environment, Forest and Climate Change, 1 July 2022. static.pib.gov.in
- Cottom, J. W., Cook, E. and Velis, C. A. (2024). A local-to-global emissions inventory of macroplastic pollution. Nature 633: 101 to 108, published 4 September 2024. nature.com
- Mehrotra, A. (reporter), Lodha, P. and Morarka, V. (editors). Educating Bangalore shopkeepers on plastic pollution. EarthJournal, Earth5R, 13 September 2015. earth5r.org
- Ministry of Environment, Forest and Climate Change (2025). Lok Sabha Unstarred Question No. 2390 on plastic pollution, answered 4 August 2025. bharatconsumers.com (copy of the Lok Sabha answer)
- Ministry of Social Justice and Empowerment (2026). Union Minister of State Shri B. L. Verma says Central Government committed to Vanchiton Ko Variyata. Press Information Bureau, 18 September 2026 (NAMASTE scheme figures). pib.gov.in
- Ministry of Housing and Urban Affairs (2026). Achievements and status of SBM-U. Press Information Bureau, 29 January 2026. pib.gov.in
- Earth5R. Tackling plastic waste at Thane with the Know Your Plastics project. EarthJournal, Earth5R. Volunteer-collected data. earth5r.org
- Earth5R. Creating benches from plastic bottle caps. EarthJournal, Earth5R, ACT Powai programme. Programme-reported. earth5r.org
- Mukhopadhyay, A. and Griffin, E. (reporters). Continuing to tackle the Powai Lake plastic pollution problem. EarthJournal, Earth5R, ACT Powai programme. earth5r.org
- Shah, A. (reporter), Lodha, P. and Morarka, V. (editors). Plastic bottles recycling program at Mumbai. EarthJournal, Earth5R. earth5r.org
- Gupta, S. Mithi River plastic waste cleanup: what 11,100 tonnes actually took. Case study, October 2020 to November 2024. Earth5R. Programme-reported. earth5r.org
- UN Environment Programme (2026). Third part of the fifth session (INC-5.3), Intergovernmental Negotiating Committee on Plastic Pollution, Geneva, 7 February 2026. unep.org
- Chair of the Intergovernmental Negotiating Committee on Plastic Pollution (2026). Fifth letter from the Chair of the INC on Plastic Pollution, 2 November 2026. UN Environment Programme. wedocs.unep.org
- Gupta, S. (2026). AI and Sustainability: Planetary Limits. EarthJournal, Earth5R. Section on the Earth5R method, Respect, Reduce, Reuse, Recycle, Restore. earth5r.org
How to cite this article
Earth5R (2026). Plastic Waste in India: 2026 Data on Generation, EPR Recycling, Open Burning and What Works on the Ground. EarthJournal, Earth5R, 16 November 2026. https://earth5r.org/plastic-waste-india/
Figures are taken from the sources cited and were current on 16 November 2026. Official plastic waste figures, polymer statistics, EPR portal totals and independent model estimates measure different things over different years, so they should not be added together or compared as if they were one series. Indian figures use lakh and crore. Earth5R figures are programme-reported or volunteer-collected and labelled as such.